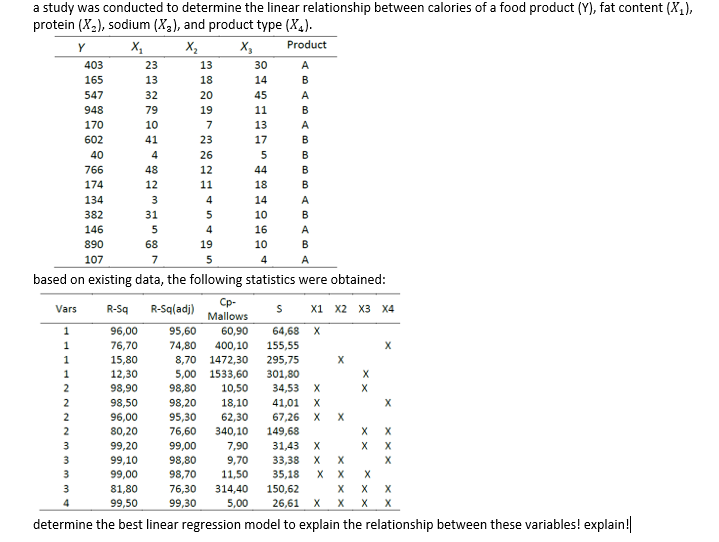
a study was conducted to determine the linear relationship between calories of a food product (Y), fat content (X₁), protein (X₂), sodium (X₂), and product type (X₂). Y X₂ X₂ X₂ Product
a study was conducted to determine the linear relationship between calories of a food product (Y), fat content (X₁), protein (X₂), sodium (X₂), and product type (X₂). Y X₂ X₂ X₂ Product

Glencoe Algebra 1, Student Edition, 9780079039897, 0079039898, 2018
18th Edition
ISBN:9780079039897
Author:Carter
Publisher:Carter
Chapter4: Equations Of Linear Functions
Section4.5: Correlation And Causation
Problem 24PFA

Related questions
Question
100%
linear regression
Transcribed Image Text:a study was conducted to determine the linear relationship between calories of a food product (Y), fat content (X₁),
protein (X₂), sodium (X3), and product type (X₂).
Y
X₁
X₂
Product
Vars
1
1
1
1
2
2
2
2
WWN
403
165
547
948
170
3
602
40
766
174
134
382
146
890
107
3
23
13
32
79
10
41
4
48
12
3
31
13
18
20
19
7
23
26
12
11
A
B
5
A
68
19
B
7
5
4
A
based on existing data, the following statistics were obtained:
4
5
X3
4
30
14
45
11
13
17
5
44
555583
7,90
9,70
99,00
98,80
98,70
11,50
76,30 314,40
99,30
18
14
10
96,00
76,70
15,80
12,30
98,90
98,50
96,00
80,20
99,20
31,43 X
99,10
33,38 X
3
99,00
35,18 X
150,62
3
81,80
4
99,50
5,00 26,61 X
determine the best linear regression model to explain the relationship between these variables! explain!
16
A
B
10
A
B
A
B
B
B
B
Cp-
R-Sq R-Sq(adj)
Mallows
95,60 60,90 64,68 X
74,80 400,10 155,55
8,70 1472,30 295,75
5,00 1533,60 301,80
98,80 10,50
98,20 18,10
34,53 X
41,01 X
67,26
149,68
95,30
62,30
76,60 340,10
S X1 X2 X3 X4
X
X X
X
X
X
X
X
X
X
X X
X
X
X X
XXX
Expert Solution
This question has been solved!
Explore an expertly crafted, step-by-step solution for a thorough understanding of key concepts.

Step by step
Solved in 2 steps

Recommended textbooks for you
Glencoe Algebra 1, Student Edition, 9780079039897…
Algebra
ISBN:
9780079039897
Author:
Carter
Publisher:
McGraw Hill

Big Ideas Math A Bridge To Success Algebra 1: Stu…
Algebra
ISBN:
9781680331141
Author:
HOUGHTON MIFFLIN HARCOURT
Publisher:
Houghton Mifflin Harcourt
Glencoe Algebra 1, Student Edition, 9780079039897…
Algebra
ISBN:
9780079039897
Author:
Carter
Publisher:
McGraw Hill
Big Ideas Math A Bridge To Success Algebra 1: Stu…
Algebra
ISBN:
9781680331141
Author:
HOUGHTON MIFFLIN HARCOURT
Publisher:
Houghton Mifflin Harcourt