The Minitab output shown below was obtained by using paired data consisting of weights (in lb) of 33 cars and their highway fuel consumption amounts (in mi/gal). Along with the paired sample data, Minitab was also given a car weight of 4500 lb to be used for predicting the highway fuel consumption amount. Use the information provided in the display to determine the value of the linear correlation coefficient. (Be careful to correctly identify the sign of the correlation coefficient.) Given that there are 33 pairs of data, is there sufficient evidence to support a claim of linear correlation between the weights of cars and their highway fuel consumption amounts? Click the icon to view the Minitab display. The linear correlation coefficient is (Round to three decimal places as needed.) Minitab output The regression equation is Highway = 50.6-0.00504 Weight Predictor SE Coef P Coef 50.557 2.829 0.000 Weight -0.0050407 0.0007681 -7.53 0.000 T 17.78 Constant S=2.12761 R-Sq=64.3% Predicted Values for New Observations New Obs 1 Fit 27.874 R-Sq(adj) = 61.9% SE Fit 0.471 Weight 4500 95% CI (26.869, 28.879) Values of Predictors for New Observations New Obs 1 95% PI (23.279, 32.469) X
The Minitab output shown below was obtained by using paired data consisting of weights (in lb) of 33 cars and their highway fuel consumption amounts (in mi/gal). Along with the paired sample data, Minitab was also given a car weight of 4500 lb to be used for predicting the highway fuel consumption amount. Use the information provided in the display to determine the value of the linear correlation coefficient. (Be careful to correctly identify the sign of the correlation coefficient.) Given that there are 33 pairs of data, is there sufficient evidence to support a claim of linear correlation between the weights of cars and their highway fuel consumption amounts? Click the icon to view the Minitab display. The linear correlation coefficient is (Round to three decimal places as needed.) Minitab output The regression equation is Highway = 50.6-0.00504 Weight Predictor SE Coef P Coef 50.557 2.829 0.000 Weight -0.0050407 0.0007681 -7.53 0.000 T 17.78 Constant S=2.12761 R-Sq=64.3% Predicted Values for New Observations New Obs 1 Fit 27.874 R-Sq(adj) = 61.9% SE Fit 0.471 Weight 4500 95% CI (26.869, 28.879) Values of Predictors for New Observations New Obs 1 95% PI (23.279, 32.469) X

Glencoe Algebra 1, Student Edition, 9780079039897, 0079039898, 2018
18th Edition
ISBN:9780079039897
Author:Carter
Publisher:Carter
Chapter4: Equations Of Linear Functions
Section4.5: Correlation And Causation
Problem 2AGP

Related questions
Question
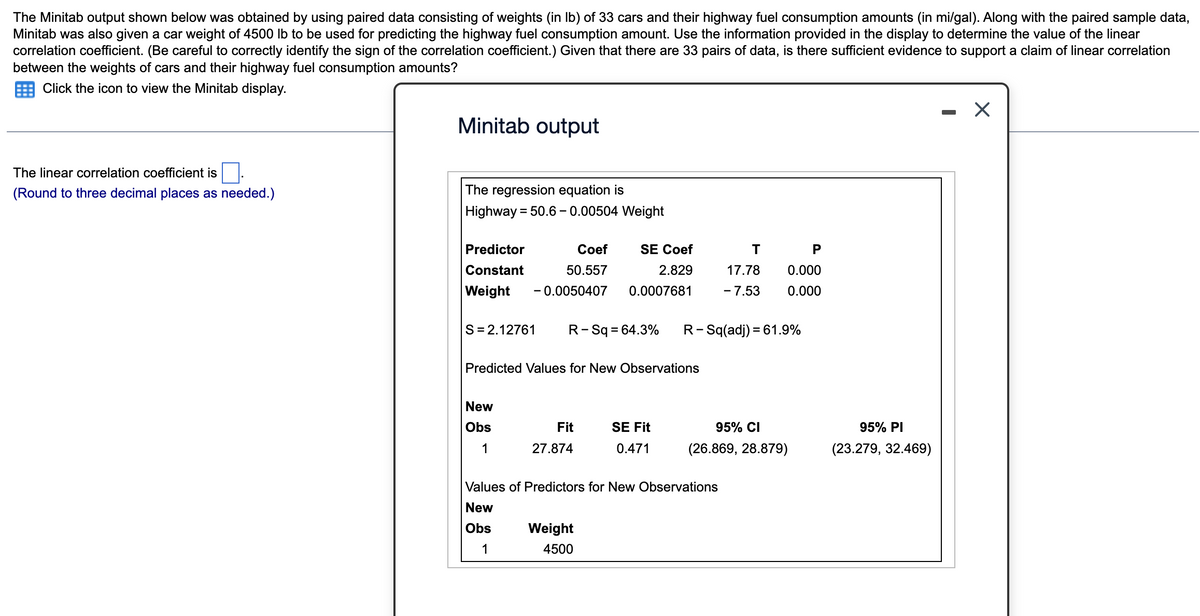
Transcribed Image Text:The Minitab output shown below was obtained by using paired data consisting of weights (in lb) of 33 cars and their highway fuel consumption amounts (in mi/gal). Along with the paired sample data,
Minitab was also given a car weight of 4500 lb to be used for predicting the highway fuel consumption amount. Use the information provided in the display to determine the value of the linear
correlation coefficient. (Be careful to correctly identify the sign of the correlation coefficient.) Given that there are 33 pairs of data, is there sufficient evidence to support a claim of linear correlation
between the weights of cars and their highway fuel consumption amounts?
Click the icon to view the Minitab display.
The linear correlation coefficient is
(Round to three decimal places as needed.)
Minitab output
The regression equation is
Highway = 50.6 -0.00504 Weight
Predictor
Coef
50.557
Weight -0.0050407 0.0007681
Constant
S=2.12761 R-Sq = 64.3%
New
Obs
1
SE Coef
2.829
Predicted Values for New Observations
Fit
27.874
Weight
4500
SE Fit
0.471
R-Sq(adj) = 61.9%
T
17.78
P
0.000
- 7.53 0.000
Values of Predictors for New Observations
New
Obs
1
95% CI
(26.869, 28.879)
95% PI
(23.279, 32.469)
X
Expert Solution
This question has been solved!
Explore an expertly crafted, step-by-step solution for a thorough understanding of key concepts.

This is a popular solution!

Trending now
This is a popular solution!

Step by step
Solved in 2 steps with 2 images

Recommended textbooks for you
Glencoe Algebra 1, Student Edition, 9780079039897…
Algebra
ISBN:
9780079039897
Author:
Carter
Publisher:
McGraw Hill

Big Ideas Math A Bridge To Success Algebra 1: Stu…
Algebra
ISBN:
9781680331141
Author:
HOUGHTON MIFFLIN HARCOURT
Publisher:
Houghton Mifflin Harcourt
Glencoe Algebra 1, Student Edition, 9780079039897…
Algebra
ISBN:
9780079039897
Author:
Carter
Publisher:
McGraw Hill
Big Ideas Math A Bridge To Success Algebra 1: Stu…
Algebra
ISBN:
9781680331141
Author:
HOUGHTON MIFFLIN HARCOURT
Publisher:
Houghton Mifflin Harcourt