A study was conducted to determine the proportion of people who dream in black and white instead of color. Among 318 people over the age of 55, 77 dream in black and white, and among 298 people under the age of 25, 16 dream in black and white. Use a 0.05 significance level to test the claim that the proportion of people over 55 who dream in black and white is greater than the proportion for those under 25. Complete parts (a) through (c) below. H: P, # P2 OF. Ho: P1 = P2 H: P, #P2 H: P1 P2 O E. Ho: P1 #P2 OD. Ho: P1 SP2 H: P1 + P2 H,: P1 =P2 Identify the test statistic. z= 6,52 (Round to two decimal places as needed.) Identify the P-value. P-value = 0.000 (Round to three decimal places as needed.) What is the conclusion based on the hypothesis test? the null hypothesis. There is sufficient evidence to support the claim that the proportion of people the significance level of a = 0.05, so over 55 who dream in black and white is greater than the proportion for those under 25. The P-value is less than reject b. Test the claim by constructing an appropriate confidence interval. The 90% confidence interval is< (P1-P2)
A study was conducted to determine the proportion of people who dream in black and white instead of color. Among 318 people over the age of 55, 77 dream in black and white, and among 298 people under the age of 25, 16 dream in black and white. Use a 0.05 significance level to test the claim that the proportion of people over 55 who dream in black and white is greater than the proportion for those under 25. Complete parts (a) through (c) below. H: P, # P2 OF. Ho: P1 = P2 H: P, #P2 H: P1 P2 O E. Ho: P1 #P2 OD. Ho: P1 SP2 H: P1 + P2 H,: P1 =P2 Identify the test statistic. z= 6,52 (Round to two decimal places as needed.) Identify the P-value. P-value = 0.000 (Round to three decimal places as needed.) What is the conclusion based on the hypothesis test? the null hypothesis. There is sufficient evidence to support the claim that the proportion of people the significance level of a = 0.05, so over 55 who dream in black and white is greater than the proportion for those under 25. The P-value is less than reject b. Test the claim by constructing an appropriate confidence interval. The 90% confidence interval is< (P1-P2)

Glencoe Algebra 1, Student Edition, 9780079039897, 0079039898, 2018
18th Edition
ISBN:9780079039897
Author:Carter
Publisher:Carter
Chapter10: Statistics
Section10.3: Measures Of Spread
Problem 1GP

Related questions

Topic Video
Question
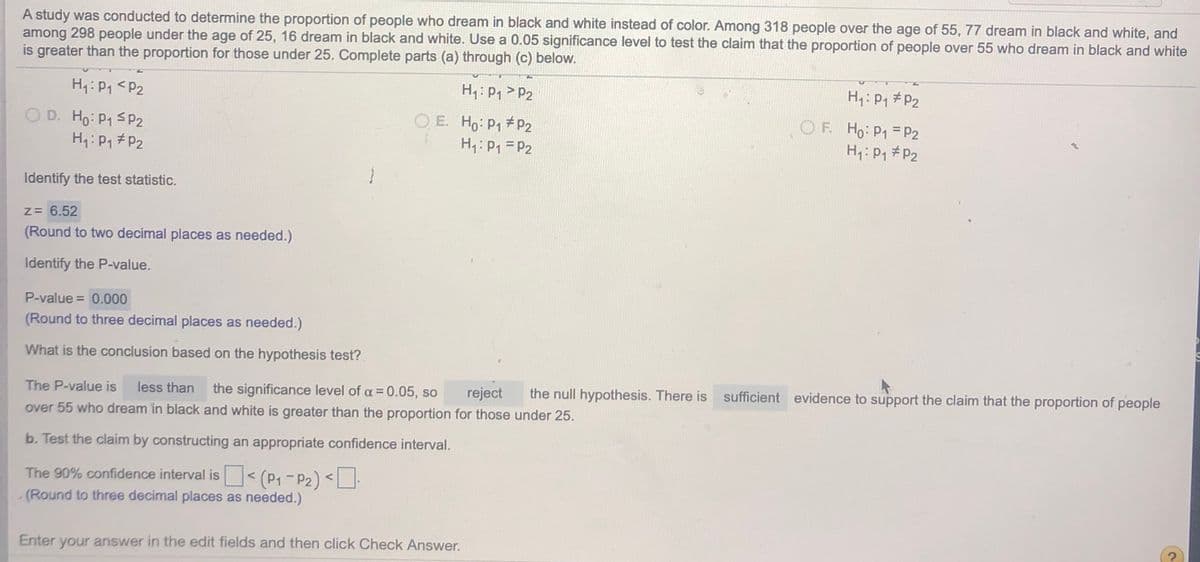
Transcribed Image Text:A study was conducted to determine the proportion of people who dream in black and white instead of color. Among 318 people over the age of 55, 77 dream in black and white, and
among 298 people under the age of 25, 16 dream in black and white. Use a 0.05 significance level to test the claim that the proportion of people over 55 who dream in black and white
is greater than the proportion for those under 25. Complete parts (a) through (c) below.
H4: P1 <P2
H: P1 > P2
H: P1 #P2
O D. Ho: P1 SP2
H1: P1#P2
O E. Ho: P1 P2
H1: P1 = P2
O F. Ho: P1 =P2
H1: P1 #P2
Identify the test statistic.
z= 6.52
(Round to two decimal places as needed.)
Identify the P-value.
P-value = 0.000
(Round to three decimal places as needed.)
What is the conclusion based on the hypothesis test?
The P-value is
less than
the significance level of a = 0.05, so
reject
the null hypothesis. There is sufficient evidence to support the claim that the proportion of people
over 55 who dream in black and white is greater than the proportion for those under 25.
b. Test the claim by constructing an appropriate confidence interval.
The 90% confidence interval is< (P1-P2) <
- (Round to three decimal places as needed.)
Enter your answer in the edit fields and then click Check Answer.
Expert Solution
This question has been solved!
Explore an expertly crafted, step-by-step solution for a thorough understanding of key concepts.

This is a popular solution!

Trending now
This is a popular solution!

Step by step
Solved in 3 steps with 2 images

Knowledge Booster


Learn more about
Need a deep-dive on the concept behind this application? Look no further. Learn more about this topic, statistics and related others by exploring similar questions and additional content below.Recommended textbooks for you
Glencoe Algebra 1, Student Edition, 9780079039897…
Algebra
ISBN:
9780079039897
Author:
Carter
Publisher:
McGraw Hill

Holt Mcdougal Larson Pre-algebra: Student Edition…
Algebra
ISBN:
9780547587776
Author:
HOLT MCDOUGAL
Publisher:
HOLT MCDOUGAL

College Algebra (MindTap Course List)
Algebra
ISBN:
9781305652231
Author:
R. David Gustafson, Jeff Hughes
Publisher:
Cengage Learning
Glencoe Algebra 1, Student Edition, 9780079039897…
Algebra
ISBN:
9780079039897
Author:
Carter
Publisher:
McGraw Hill
Holt Mcdougal Larson Pre-algebra: Student Edition…
Algebra
ISBN:
9780547587776
Author:
HOLT MCDOUGAL
Publisher:
HOLT MCDOUGAL
College Algebra (MindTap Course List)
Algebra
ISBN:
9781305652231
Author:
R. David Gustafson, Jeff Hughes
Publisher:
Cengage Learning
