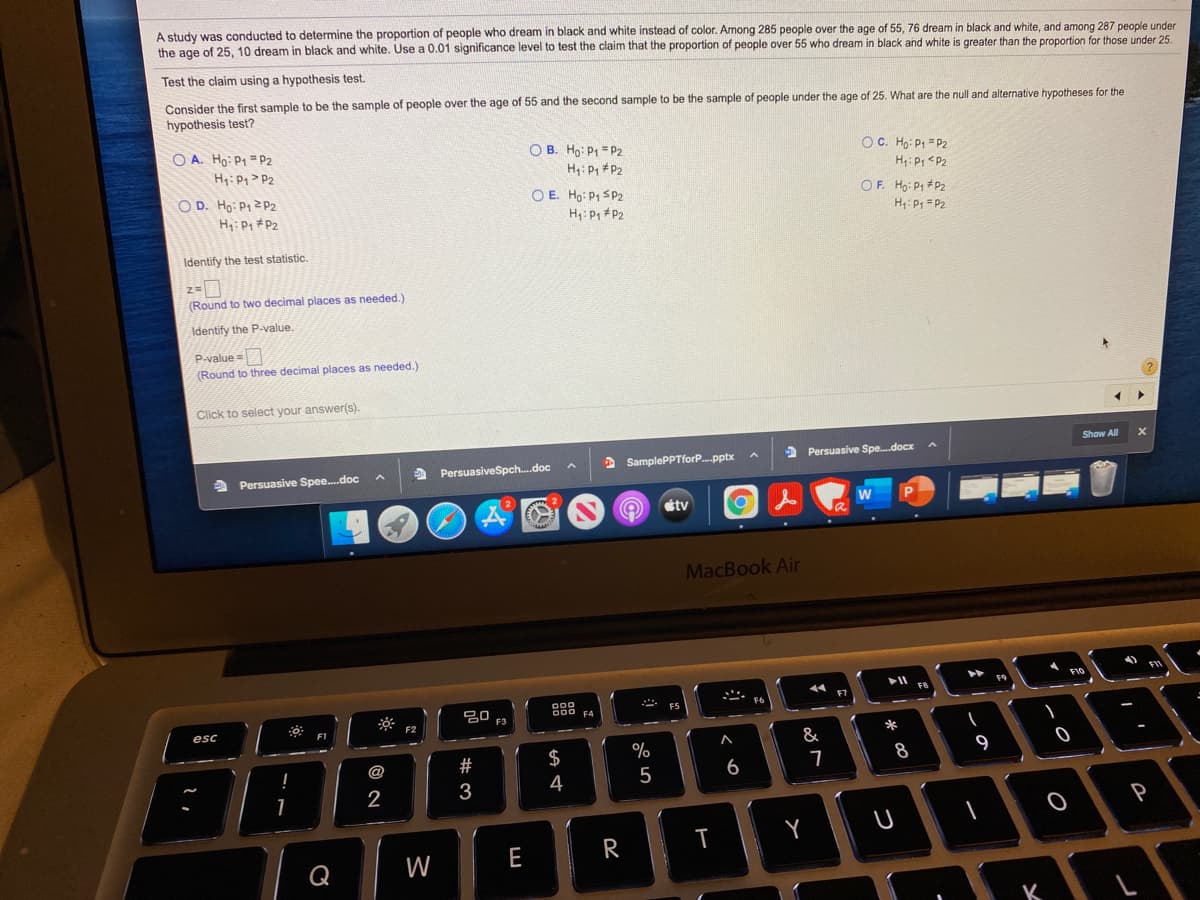
A study was conducted to determine the proportion of people who dream in black and white instead of color. Among 285 people over the age of 55, 76 dream in black and white, and among 287 people under the age of 25, 10 dream in black and white. Use a 0.01 significance level to test the claim that the proportion of people over 55 who dream black and white is greater than the proportion for those under 25. Test the claim using a hypothesis test. Consider the first sample to be the sample of people over the age of 55 and the second sample to be the sample of people under the age of 25. What are the null and alternative hypotheses for the hypothesis test? OC. Ho: P =P2 H: P P2 H: P #P2 OF. Ho: P Pz O E. Ho: P1 SP2 H: P = P2 O D. Ho: P1 2 P2 H: P1 P2 H: P +P2 Identify the test statistic. (Round to two decimal places as needed.) Identify the P-value. P-value = (Round to three decimal places as needed.)
A study was conducted to determine the proportion of people who dream in black and white instead of color. Among 285 people over the age of 55, 76 dream in black and white, and among 287 people under the age of 25, 10 dream in black and white. Use a 0.01 significance level to test the claim that the proportion of people over 55 who dream black and white is greater than the proportion for those under 25. Test the claim using a hypothesis test. Consider the first sample to be the sample of people over the age of 55 and the second sample to be the sample of people under the age of 25. What are the null and alternative hypotheses for the hypothesis test? OC. Ho: P =P2 H: P P2 H: P #P2 OF. Ho: P Pz O E. Ho: P1 SP2 H: P = P2 O D. Ho: P1 2 P2 H: P1 P2 H: P +P2 Identify the test statistic. (Round to two decimal places as needed.) Identify the P-value. P-value = (Round to three decimal places as needed.)

Glencoe Algebra 1, Student Edition, 9780079039897, 0079039898, 2018
18th Edition
ISBN:9780079039897
Author:Carter
Publisher:Carter
Chapter10: Statistics
Section10.6: Summarizing Categorical Data
Problem 30PPS

Related questions

Topic Video
Question

Transcribed Image Text:A study was conducted to determine the proportion of people who dream in black and white instead of color. Among 285 people over the age of 55, 76 dream in black and white, and among 287 people under
the age of 25, 10 dream in black and white. Use a 0.01 significance level to test the claim that the proportion of people over 55 who dream in black and white is greater than the proportion for those under 25.
Identify the P-value.
P-value =
(Round to three decimal places as needed.)
What is the conclusion based on the hypothesis test?
The P-value is
V the significance level of a = 0.01, so
black and white is greater than the proportion for those under 25.
the null hypothesis. There is
V evidence to support the claim that the proportion of people over 55 who dream in
An explanation for the results is that those over the age of 55 grew
reject
that was displayed in black and white. Can these results be used to verify that explanation?
O A. Yes. The results can be used to verify the given explanatior
fail to reject
ce in proportions is statistically significant.
O B. Yes. The results can be used to verify the given explanation because the difference in proportions is practically significant.
O C. No. The results speak to a possible difference between the proportions of people over 55 and under 25 who dream in black and white, but the results are not statistically significant enough to verify
the cause of such a difference.
O D. No. The results speak to a possible difference between the proportions of people over 55 and under 25 who dream in black and white, but the results cannot be used to verify the cause of such a
difference.
Click to select your answer(s).
Show All
a Persuasive Spee.doc
A PersuasiveSpch.doc
A SamplePPTforP.pptx
> Persuasive Spe.docx
stv
MacBook Air
- F6
888
ES
F3
F2
F1
del
&
23
$
%
@
5
6
3
4
P
T
Y
E
R
W
tab
っ
K
F
G
S
レー
の
つ
I
Transcribed Image Text:A study was conducted to determine the proportion of people who dream in black and white instead of color. Among 285 people over the age of 55, 76 dream in black and white, and among 287 people under
the age of 25, 10 dream in black and white. Use a 0.01 significance level to test the claim that the proportion of people over 55 who dream in black and white is greater than the proportion for those under 25.
Test the claim using a hypothesis test.
Consider the first sample to be the sample of people over the age of 55 and the second sample to be the sample of people under the age of 25. What are the null and alternative hypotheses for the
hypothesis test?
O A. Ho: P1 = P2
H: P1> P2
O B. Ho: P1 = P2
OC. Ho: P1 = P2
H: P <P2
H4: P, #P2
O D. Ho: P12 P2
H: P, #P2
O E. Ho: P1 SP2
H: P, P2
OF. Ho: P1 +P2
H: P, = P2
Identify the test statistic.
(Round to two decimal places as needed.)
Identify the P-value.
P-value =
(Round to three decimal places as needed.)
Click to select your answer(s).
Show A
2 SamplePPTforP..pptx
> Persuasive Spe.docx
a Persuasive Spee.doc
a PersuasiveSpch.doc
tv
MacBook Air
F10
F9
心.
20 F3
FS
esc
F1
F2
&
$
%
8
9
@
4
5
6
2
Y
W
E
R
K
#3
Expert Solution
This question has been solved!
Explore an expertly crafted, step-by-step solution for a thorough understanding of key concepts.

Step by step
Solved in 3 steps with 4 images

Knowledge Booster


Learn more about
Need a deep-dive on the concept behind this application? Look no further. Learn more about this topic, statistics and related others by exploring similar questions and additional content below.Recommended textbooks for you
Glencoe Algebra 1, Student Edition, 9780079039897…
Algebra
ISBN:
9780079039897
Author:
Carter
Publisher:
McGraw Hill

College Algebra (MindTap Course List)
Algebra
ISBN:
9781305652231
Author:
R. David Gustafson, Jeff Hughes
Publisher:
Cengage Learning

Glencoe Algebra 1, Student Edition, 9780079039897…
Algebra
ISBN:
9780079039897
Author:
Carter
Publisher:
McGraw Hill
College Algebra (MindTap Course List)
Algebra
ISBN:
9781305652231
Author:
R. David Gustafson, Jeff Hughes
Publisher:
Cengage Learning