т-Тest Notes Output Created 11-APR-2019 20:01:49 Comments Input Active Dataset DataSeti Fiter none> Weight Split Fle Nof Rows in Working Data Fle enone 11 Missing Value Handing Definition of Missing User defined missing values are treated as missing. Statistics for each analysis are based on the cases with no missing or out-ot- range data for any variable in the analysis Cases Used T-TEST GROUPS-gender (12) MISSINGANALYSIS Syntax NARIABLES-test_score ICRITERIA-CK95). Resources Processor Time 00:00:00.00 Elapsed Time 00:00:00.01 Group Statistics Std. Deviation Std. Eror Mean N Mean gender 5 77.2000 7.08520 3.16860 238048 test_score male females 81.0000 5.83095
т-Тest Notes Output Created 11-APR-2019 20:01:49 Comments Input Active Dataset DataSeti Fiter none> Weight Split Fle Nof Rows in Working Data Fle enone 11 Missing Value Handing Definition of Missing User defined missing values are treated as missing. Statistics for each analysis are based on the cases with no missing or out-ot- range data for any variable in the analysis Cases Used T-TEST GROUPS-gender (12) MISSINGANALYSIS Syntax NARIABLES-test_score ICRITERIA-CK95). Resources Processor Time 00:00:00.00 Elapsed Time 00:00:00.01 Group Statistics Std. Deviation Std. Eror Mean N Mean gender 5 77.2000 7.08520 3.16860 238048 test_score male females 81.0000 5.83095

MATLAB: An Introduction with Applications
6th Edition
ISBN:9781119256830
Author:Amos Gilat
Publisher:Amos Gilat
Chapter1: Starting With Matlab
Section: Chapter Questions
Problem 1P

Related questions
Topic Video
Question
Independent Samples t-test
Analyze data in SPSS using an independent samples t-test •
Imagine that we in the difference in history test scores between males and females. How might we test this question? (basic research design)
Do the 4 steps of hypothesis testing (use the SPSS output sent):
Step 1
- Write null hypothesis
- Write research hypothesis
Step 2
- Use a two-tailed test with alpha set to a = .05**
what is the critical region?
Step 3
-what is the p-value?
-what is the t-statistic?
Step 4
-determine whether results are statistically significant
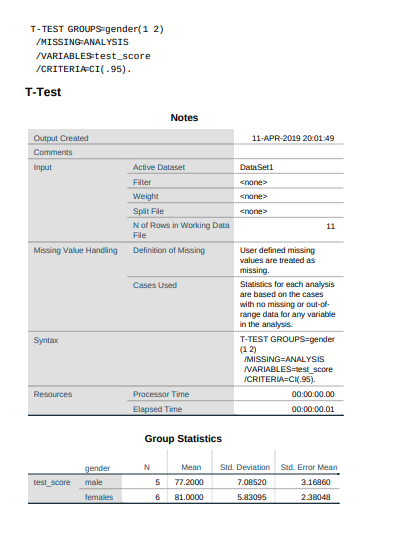
Transcribed Image Text:T-TEST GROUPS-gender(1 2)
/MISSING ANALYSIS
VARIABLES test_score
/CRITERIA CI(-95).
T-Test
Notes
Output Created
11-APR-2019 20:01:49
Comments
Input
Active Dataset
DataSeti
Filter
<none>
Weight
<none>
Split File
<none>
Nof Rows in Working Data
File
11
Missing Value Handling Definition of Missing
User defined missing
values are treated as
missing.
Statistics for each analysis
are based on the cases
Cases Used
with no missing or out-of-
range data for any variable
in the analysis.
T-TEST GROUPS=gender
(1 2)
MISSING=ANALYSIS
NARIABLES=test_score
ICRITERIA=CI(.95).
Syntax
Resources
Processor Time
00:00:00.00
Elapsed Time
00:00:00.01
Group Statistics
gender
N
Mean
Std. Deviation Sid. Error Mean
test score
male
5
77.2000
7.08520
3.16860
females
6
81.0000
5.83095
2.38048
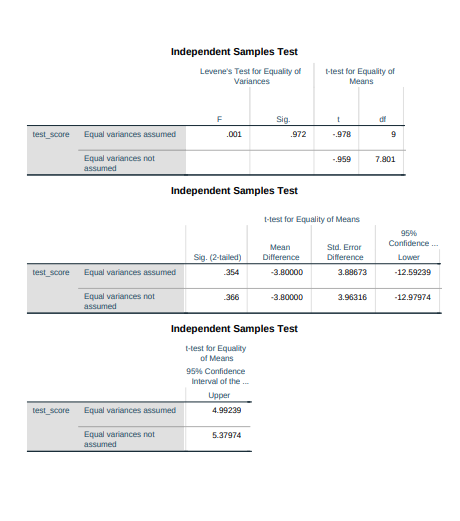
Transcribed Image Text:Independent Samples Test
Levene's Test for Equality of
Variances
t-test for Equality of
Means
F
Sig.
test_score
Equal variances assumed
.001
.972
-.978
Equal variances not
assumed
-.959
7.801
Independent Samples Test
t-test for Equality of Means
95%
Std. Error
Confidence.
Mean
Sig. (2-tailed)
Difference
Difference
Lower
test score
Equal variances assumed
354
-3.80000
3.89673
-12.59239
Equal variances not
assumed
366
-3.80000
3.96316
-12.97974
Independent Samples Test
t-test for Equality
of Means
95% Confidence
Interval of the .
Upper
test score
Equal variances assumed
4.99239
Equal variances not
assumed
5.37974
Expert Solution
This question has been solved!
Explore an expertly crafted, step-by-step solution for a thorough understanding of key concepts.

This is a popular solution!

Trending now
This is a popular solution!

Step by step
Solved in 2 steps

Knowledge Booster


Learn more about
Need a deep-dive on the concept behind this application? Look no further. Learn more about this topic, statistics and related others by exploring similar questions and additional content below.Recommended textbooks for you
MATLAB: An Introduction with Applications
Statistics
ISBN:
9781119256830
Author:
Amos Gilat
Publisher:
John Wiley & Sons Inc

Probability and Statistics for Engineering and th…
Statistics
ISBN:
9781305251809
Author:
Jay L. Devore
Publisher:
Cengage Learning

Statistics for The Behavioral Sciences (MindTap C…
Statistics
ISBN:
9781305504912
Author:
Frederick J Gravetter, Larry B. Wallnau
Publisher:
Cengage Learning
MATLAB: An Introduction with Applications
Statistics
ISBN:
9781119256830
Author:
Amos Gilat
Publisher:
John Wiley & Sons Inc
Probability and Statistics for Engineering and th…
Statistics
ISBN:
9781305251809
Author:
Jay L. Devore
Publisher:
Cengage Learning
Statistics for The Behavioral Sciences (MindTap C…
Statistics
ISBN:
9781305504912
Author:
Frederick J Gravetter, Larry B. Wallnau
Publisher:
Cengage Learning

Elementary Statistics: Picturing the World (7th E…
Statistics
ISBN:
9780134683416
Author:
Ron Larson, Betsy Farber
Publisher:
PEARSON

The Basic Practice of Statistics
Statistics
ISBN:
9781319042578
Author:
David S. Moore, William I. Notz, Michael A. Fligner
Publisher:
W. H. Freeman

Introduction to the Practice of Statistics
Statistics
ISBN:
9781319013387
Author:
David S. Moore, George P. McCabe, Bruce A. Craig
Publisher:
W. H. Freeman