A study was done to look at the relationship between number of lovers college students have had in their lifetimes and their GPAS. The results of the survey are shown below. Lovers 4 4 6 7 GPA 1.9 2.3 2.9 1.3 2.9 3.9 1.1 a. Find the correlation coefficient: r = Round to 2 decimal places. b. The null and alternative hypotheses for correlation are: Но: (? H1: (? The p-value is: (Round to four decimal places) c. Use a level of significance of a = conclusion of the hypothesis test in the context of the study. - 0.05 to state the | There is statistically significant evidence to conclude that a student who has had more lovers will have a lower GPA than a student who has had fewer lovers. |There is statistically insignificant evidence to conclude that there is a correlation between the number of lovers students have had in their lifetimes and their GPA. Thus, the use of the regression line is not appropriate. | There is statistically significant evidence to conclude that there is a correlation between the number of lovers students have had in their lifetimes and their GPA. Thus, the regression line is useful. |There is statistically insignificant evidence to conclude that a student who has had more lovers will have a lower GPA than a student who has had fewer lovers. d. p? = (Round to two decimal places) %3D
A study was done to look at the relationship between number of lovers college students have had in their lifetimes and their GPAS. The results of the survey are shown below. Lovers 4 4 6 7 GPA 1.9 2.3 2.9 1.3 2.9 3.9 1.1 a. Find the correlation coefficient: r = Round to 2 decimal places. b. The null and alternative hypotheses for correlation are: Но: (? H1: (? The p-value is: (Round to four decimal places) c. Use a level of significance of a = conclusion of the hypothesis test in the context of the study. - 0.05 to state the | There is statistically significant evidence to conclude that a student who has had more lovers will have a lower GPA than a student who has had fewer lovers. |There is statistically insignificant evidence to conclude that there is a correlation between the number of lovers students have had in their lifetimes and their GPA. Thus, the use of the regression line is not appropriate. | There is statistically significant evidence to conclude that there is a correlation between the number of lovers students have had in their lifetimes and their GPA. Thus, the regression line is useful. |There is statistically insignificant evidence to conclude that a student who has had more lovers will have a lower GPA than a student who has had fewer lovers. d. p? = (Round to two decimal places) %3D

Glencoe Algebra 1, Student Edition, 9780079039897, 0079039898, 2018
18th Edition
ISBN:9780079039897
Author:Carter
Publisher:Carter
Chapter4: Equations Of Linear Functions
Section4.5: Correlation And Causation
Problem 24PFA

Related questions
Question
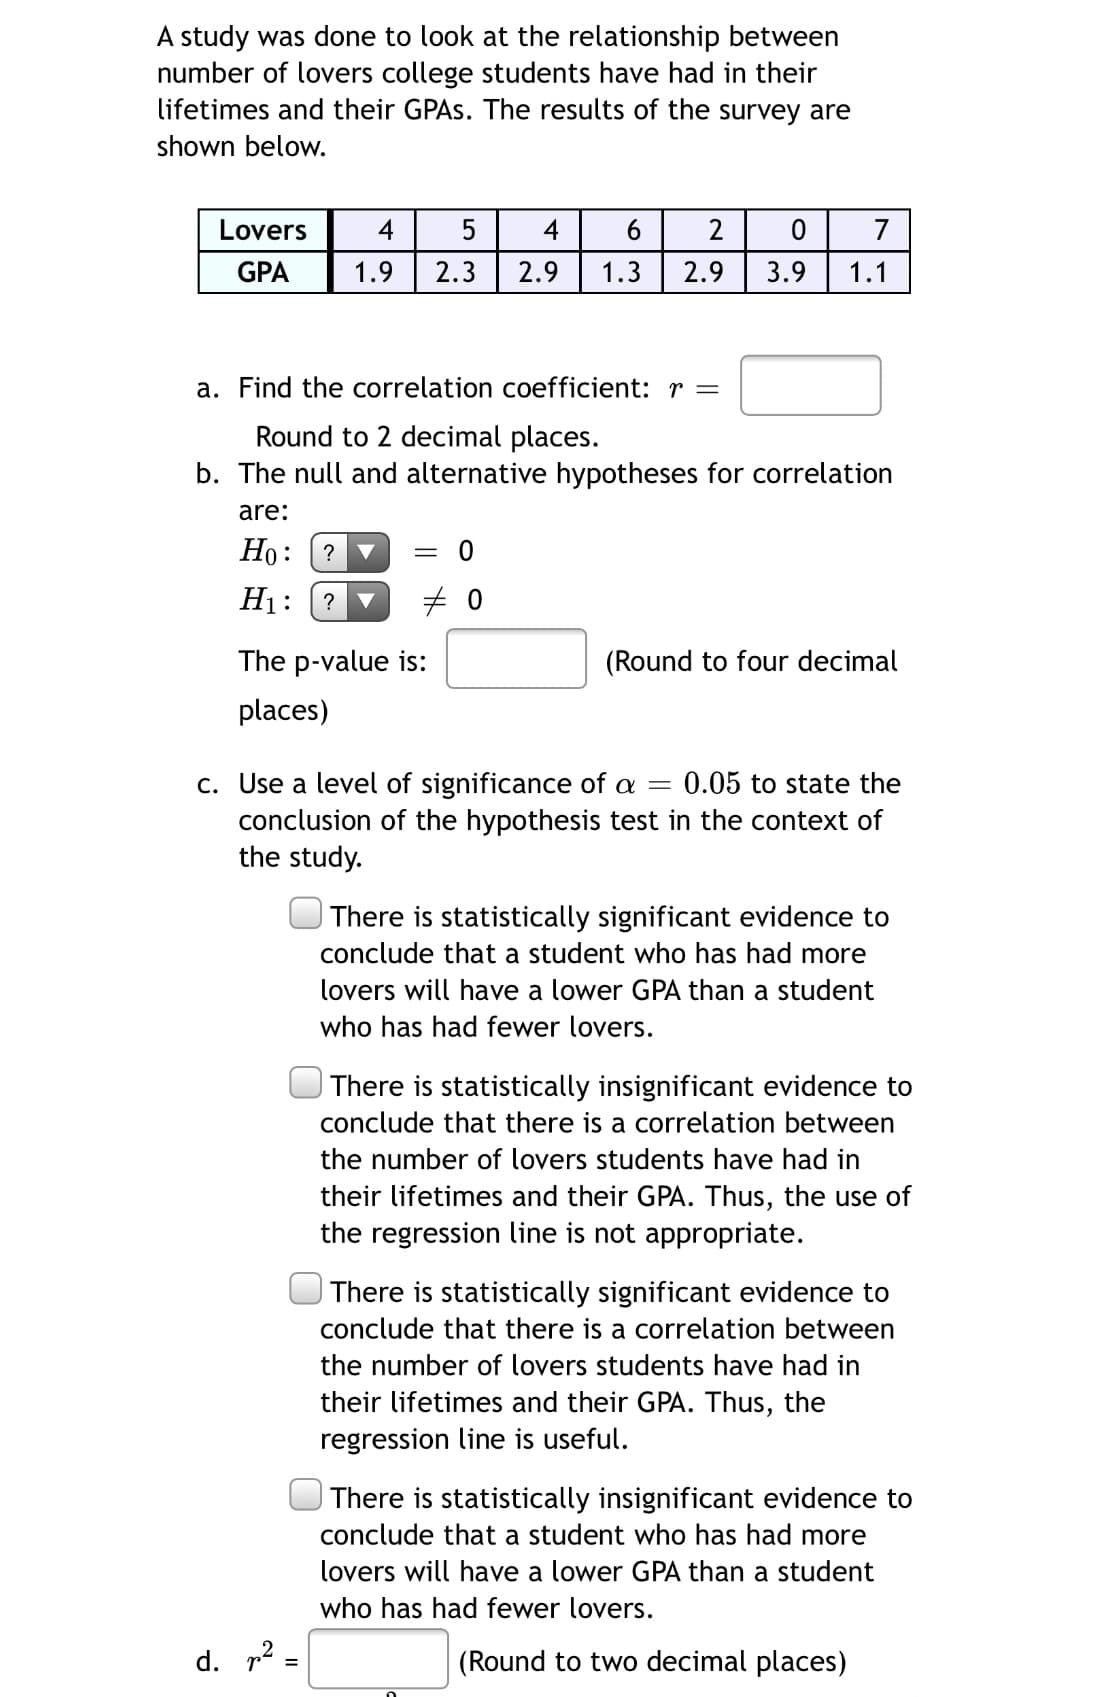
Transcribed Image Text:A study was done to look at the relationship between
number of lovers college students have had in their
lifetimes and their GPAS. The results of the survey are
shown below.
Lovers
4
5
4
2
7
GPA
1.9
2.3
2.9
1.3
2.9
3.9
1.1
a. Find the correlation coefficient: r =
Round to 2 decimal places.
b. The null and alternative hypotheses for correlation
are:
Но:
?
H1:
?
The p-value is:
(Round to four decimal
places)
c. Use a level of significance of a
conclusion of the hypothesis test in the context of
the study.
:0.05 to state the
There is statistically significant evidence to
conclude that a student who has had more
lovers will have a lower GPA than a student
who has had fewer lovers.
| There is statistically insignificant evidence to
conclude that there is a correlation between
the number of lovers students have had in
their lifetimes and their GPA. Thus, the use of
the regression line is not appropriate.
There is statistically significant evidence to
conclude that there is a correlation between
the number of lovers students have had in
their lifetimes and their GPA. Thus, the
regression line is useful.
| There is statistically insignificant evidence to
conclude that a student who has had more
lovers will have a lower GPA than a student
who has had fewer lovers.
d. 12:
(Round to two decimal places)
%3D
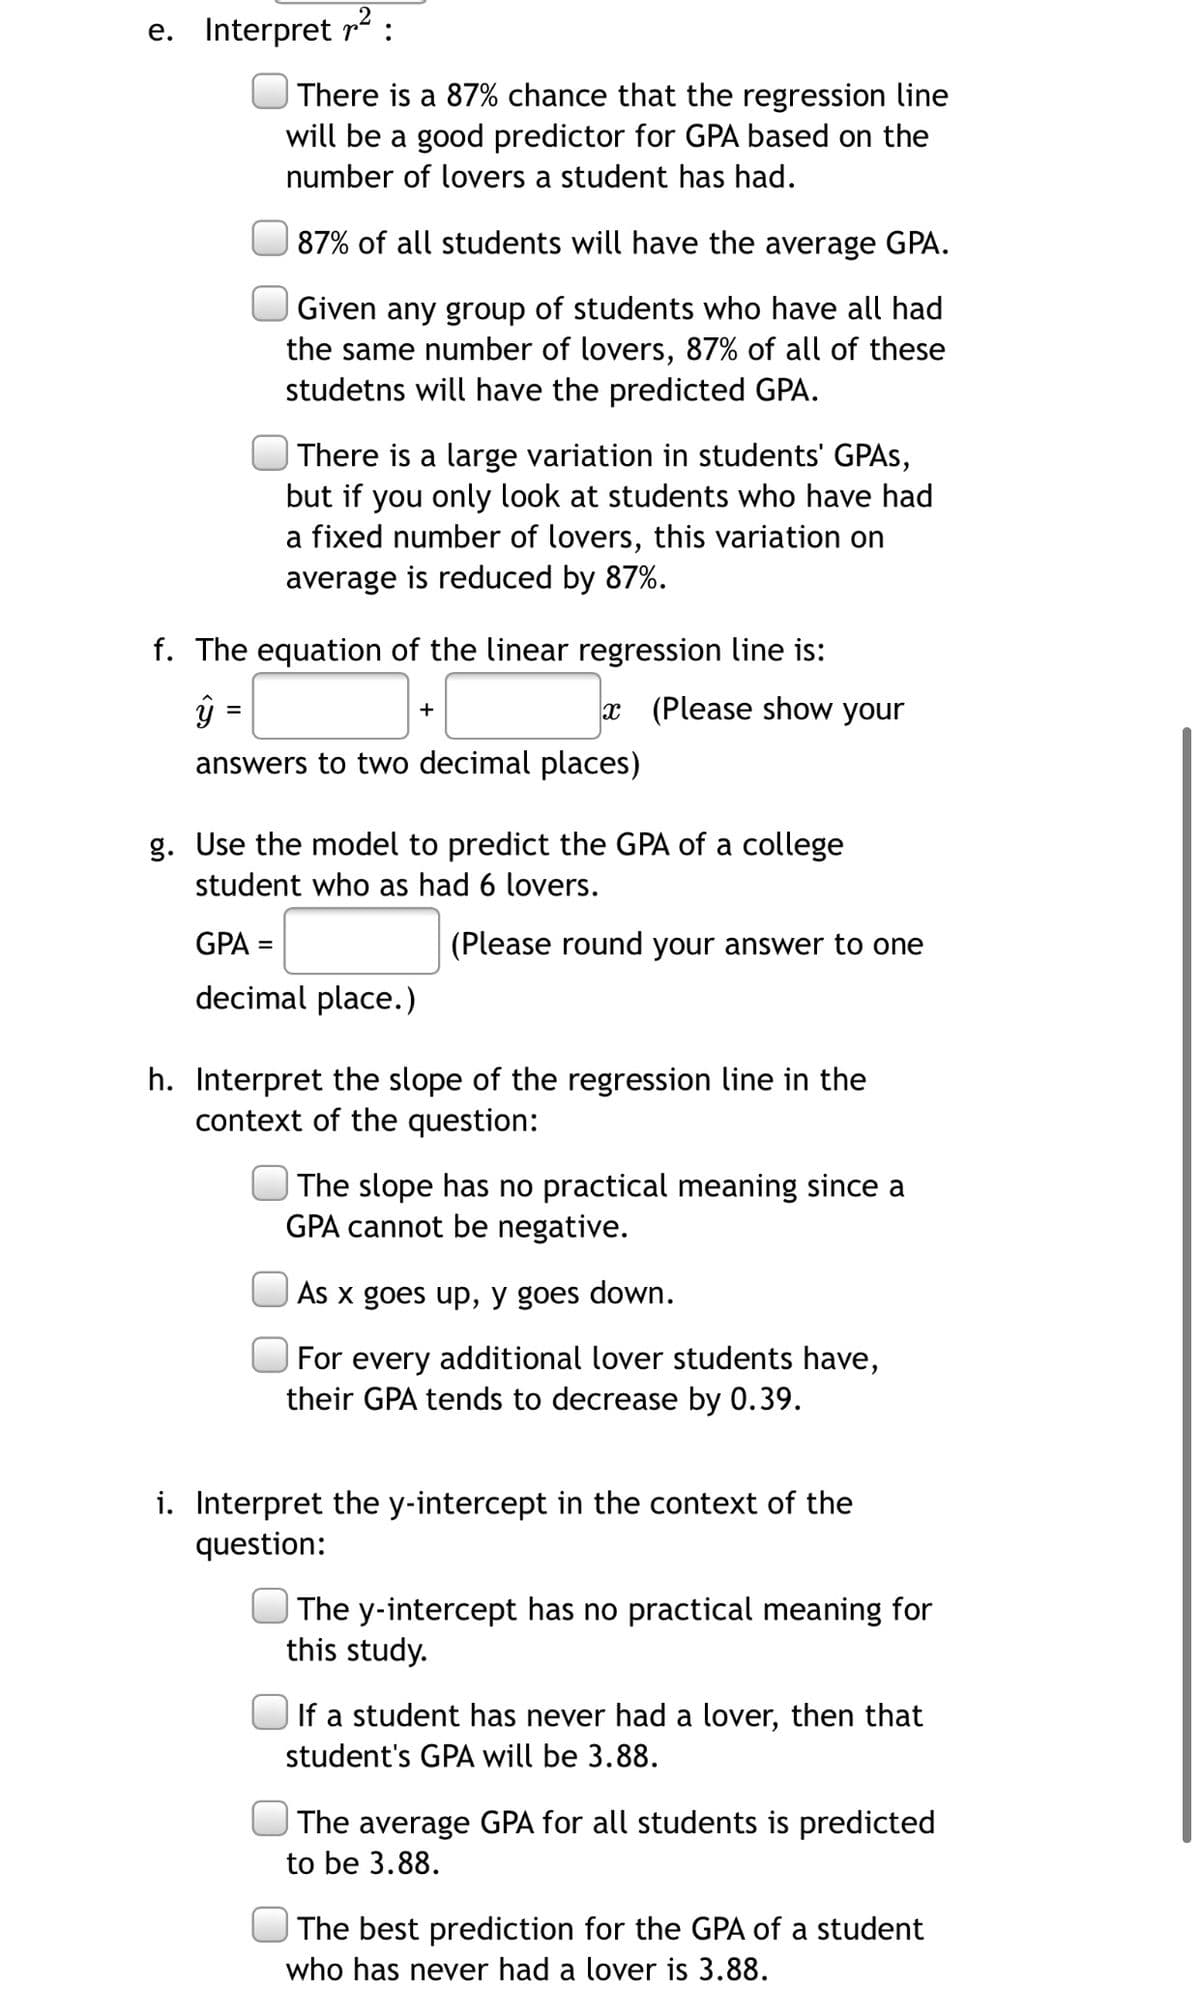
Transcribed Image Text:e. Interpret r2 :
There is a 87% chance that the regression line
will be a good predictor for GPA based on the
number of lovers a student has had.
87% of all students will have the average GPA.
Given any group of students who have all had
the same number of lovers, 87% of all of these
studetns will have the predicted GPA.
There is a large variation in students' GPAS,
but if you only look at students who have had
a fixed number of lovers, this variation on
average is reduced by 87%.
f. The equation of the linear regression line is:
ŷ =
x (Please show your
+
answers to two decimal places)
g. Use the model to predict the GPA of a college
student who as had 6 lovers.
GPA =
(Please round your answer to one
decimal place.)
h. Interpret the slope of the regression line in the
context of the question:
The slope has no practical meaning since a
GPA cannot be negative.
As x goes up, y goes down.
For every additional lover students have,
their GPA tends to decrease by 0.39.
i. Interpret the y-intercept in the context of the
question:
| The y-intercept has no practical meaning for
this study.
If a student has never had a lover, then that
student's GPA will be 3.88.
The average GPA for all students is predicted
to be 3.88.
The best prediction for the GPA of a student
who has never had a lover is 3.88.
Expert Solution
This question has been solved!
Explore an expertly crafted, step-by-step solution for a thorough understanding of key concepts.

This is a popular solution!

Trending now
This is a popular solution!

Step by step
Solved in 2 steps with 4 images

Recommended textbooks for you
Glencoe Algebra 1, Student Edition, 9780079039897…
Algebra
ISBN:
9780079039897
Author:
Carter
Publisher:
McGraw Hill
Glencoe Algebra 1, Student Edition, 9780079039897…
Algebra
ISBN:
9780079039897
Author:
Carter
Publisher:
McGraw Hill