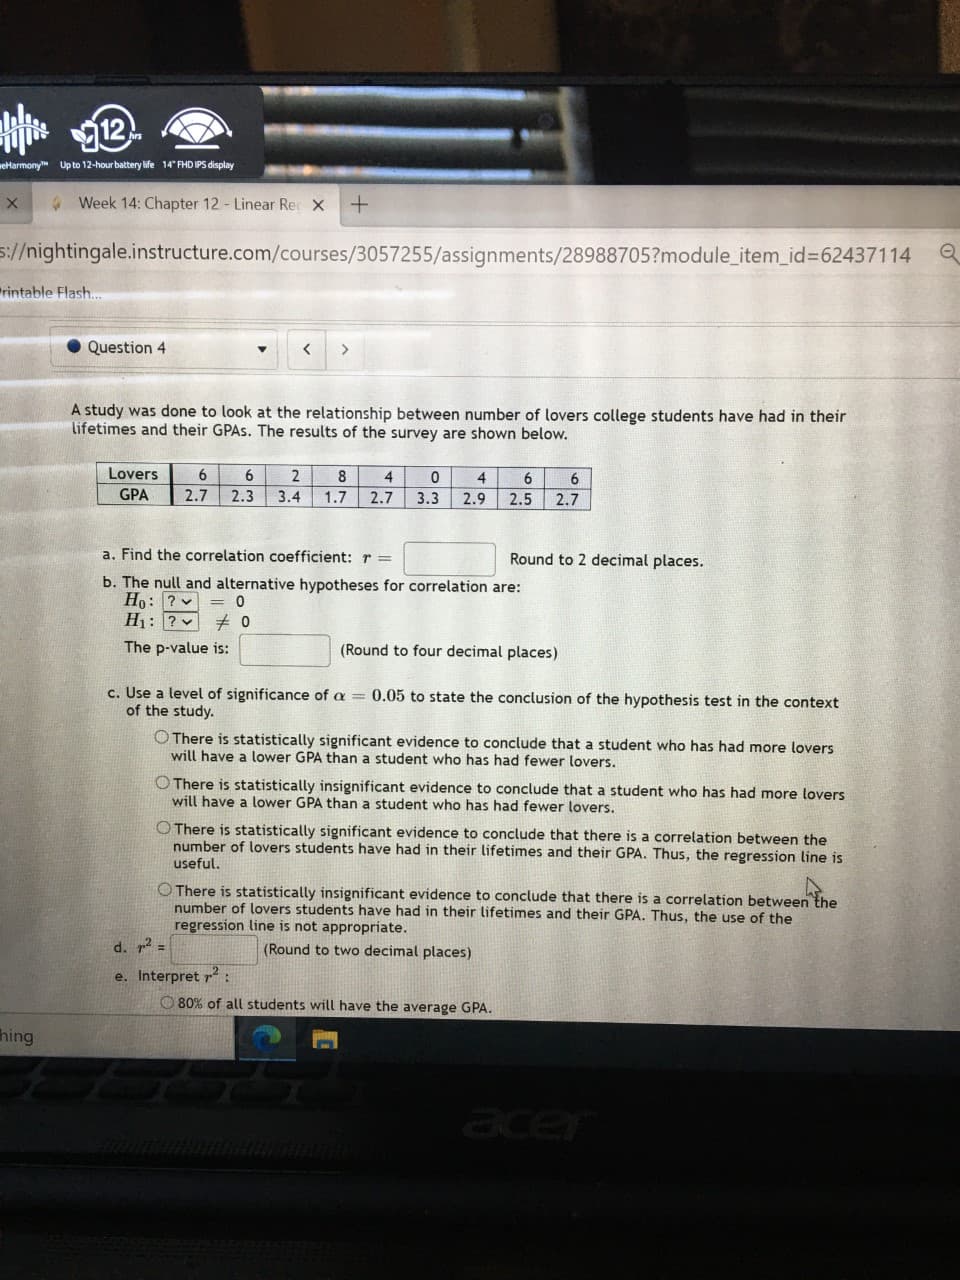
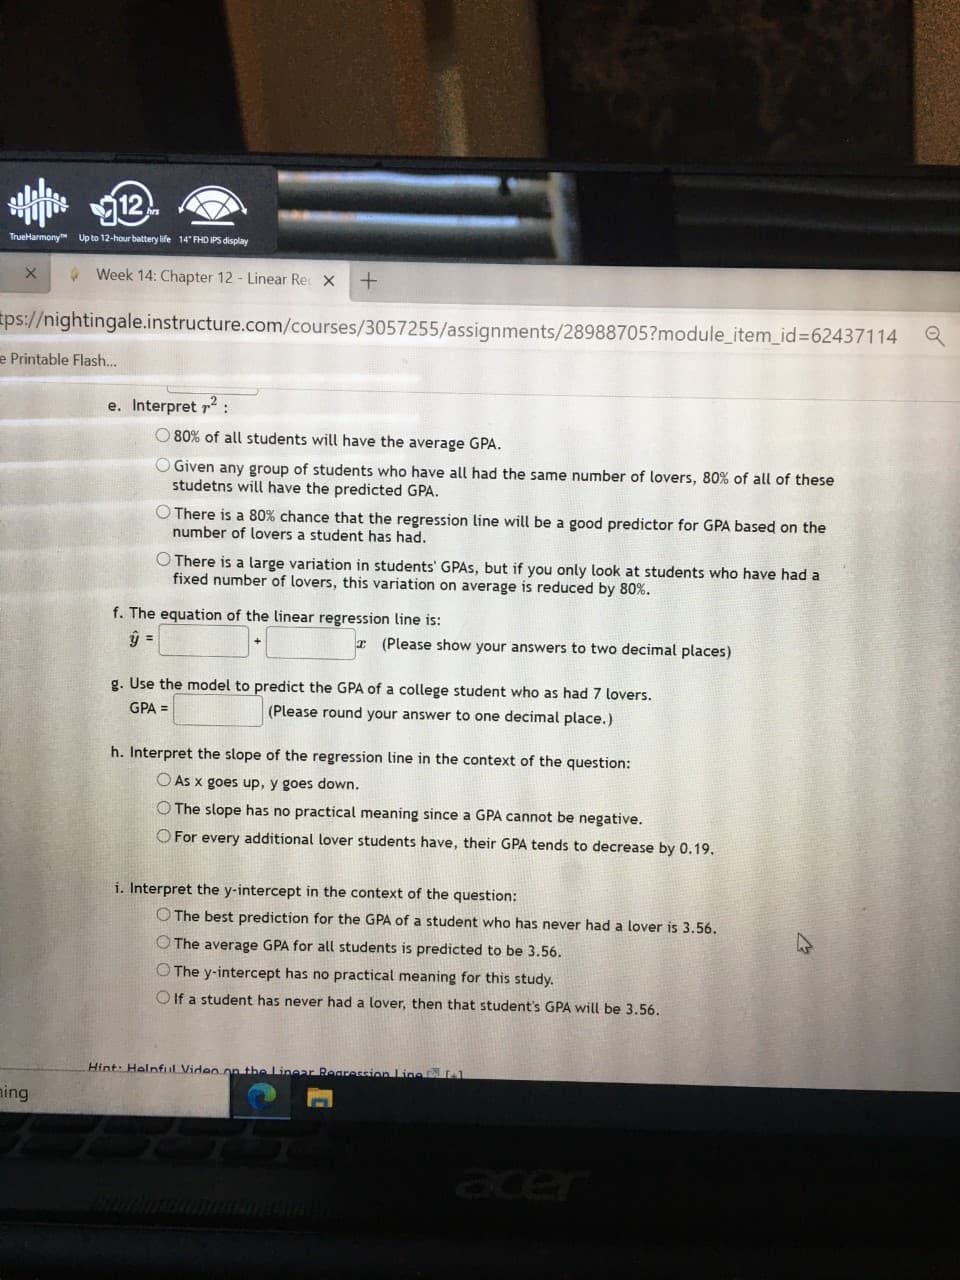
A study was done to look at the relationship between number of lovers college students have had in their lifetimes and their GPAS. The results of the survey are shown below. Lovers 8 4 0 3.3 2.9 2 4 GPA 2.7 2.3 3.4 1.7 2.7 2.5 2.7 a. Find the correlation coefficient: r Round to 2 decimal places. b. The null and alternative hypotheses for correlation are: Ho: ? H1: ? The p-value is: (Round to four decimal places) c. Use a level of significance of a of the study. 0.05 to state the conclusion of the hypothesis test in the context


Angles in Circles
Angles within a circle are feasible to create with the help of different properties of the circle such as radii, tangents, and chords. The radius is the distance from the center of the circle to the circumference of the circle. A tangent is a line made perpendicular to the radius through its endpoint placed on the circle as well as the line drawn at right angles to a tangent across the point of contact when the circle passes through the center of the circle. The chord is a line segment with its endpoints on the circle. A secant line or secant is the infinite extension of the chord.
Arcs in Circles
A circular arc is the arc of a circle formed by two distinct points. It is a section or segment of the circumference of a circle. A straight line passing through the center connecting the two distinct ends of the arc is termed a semi-circular arc.
Pictures attached


Trending now
This is a popular solution!

Step by step
Solved in 3 steps


