A study was done to look at the relationship between number of movies people watch at the theater each year and the number of books that they read each year. The results of the survey are shown below. Movies 10 3. 10 8. 8. 9. Books 13 0. 3. a. Find the correlation coefficient: T = -0.92 Round to 2 decimal places. b. The null and alternative hypotheses for correlation are: Ho: pv = 0 H1: pv 0 The p-value is: 0.0012 Round to 4 decimal places. C. Use a level of significance of a = 0.05 to state the conclusion of the hypothesis test in the context of the study. O There is statistically significant evidence to conclude that there is a correlation between the number of movies watched per year and the number of books read per year. Thus, the regression line is useful. O There is statistically significant evidence to conclude that a person who watches fewer movies will read fewer books than a person who watches fewer movies. O There is statistically significant evidence to conclude that a person who watches more movies will read fewer books than a person who watches fewer movies. O There is statistically insignificant evidence to conclude that there is a correlation between the number of movies watched per year and the number of books read per year. Thus, the use of the regression line is not appropriate. d. r2 = (Round to two decimal places) %3D e. Interpret r : ach voar but if you only look at
A study was done to look at the relationship between number of movies people watch at the theater each year and the number of books that they read each year. The results of the survey are shown below. Movies 10 3. 10 8. 8. 9. Books 13 0. 3. a. Find the correlation coefficient: T = -0.92 Round to 2 decimal places. b. The null and alternative hypotheses for correlation are: Ho: pv = 0 H1: pv 0 The p-value is: 0.0012 Round to 4 decimal places. C. Use a level of significance of a = 0.05 to state the conclusion of the hypothesis test in the context of the study. O There is statistically significant evidence to conclude that there is a correlation between the number of movies watched per year and the number of books read per year. Thus, the regression line is useful. O There is statistically significant evidence to conclude that a person who watches fewer movies will read fewer books than a person who watches fewer movies. O There is statistically significant evidence to conclude that a person who watches more movies will read fewer books than a person who watches fewer movies. O There is statistically insignificant evidence to conclude that there is a correlation between the number of movies watched per year and the number of books read per year. Thus, the use of the regression line is not appropriate. d. r2 = (Round to two decimal places) %3D e. Interpret r : ach voar but if you only look at

Glencoe Algebra 1, Student Edition, 9780079039897, 0079039898, 2018
18th Edition
ISBN:9780079039897
Author:Carter
Publisher:Carter
Chapter4: Equations Of Linear Functions
Section4.5: Correlation And Causation
Problem 15PPS

Related questions

Concept explainers
Contingency Table
A contingency table can be defined as the visual representation of the relationship between two or more categorical variables that can be evaluated and registered. It is a categorical version of the scatterplot, which is used to investigate the linear relationship between two variables. A contingency table is indeed a type of frequency distribution table that displays two variables at the same time.
Binomial Distribution
Binomial is an algebraic expression of the sum or the difference of two terms. Before knowing about binomial distribution, we must know about the binomial theorem.
Topic Video
Question
repost
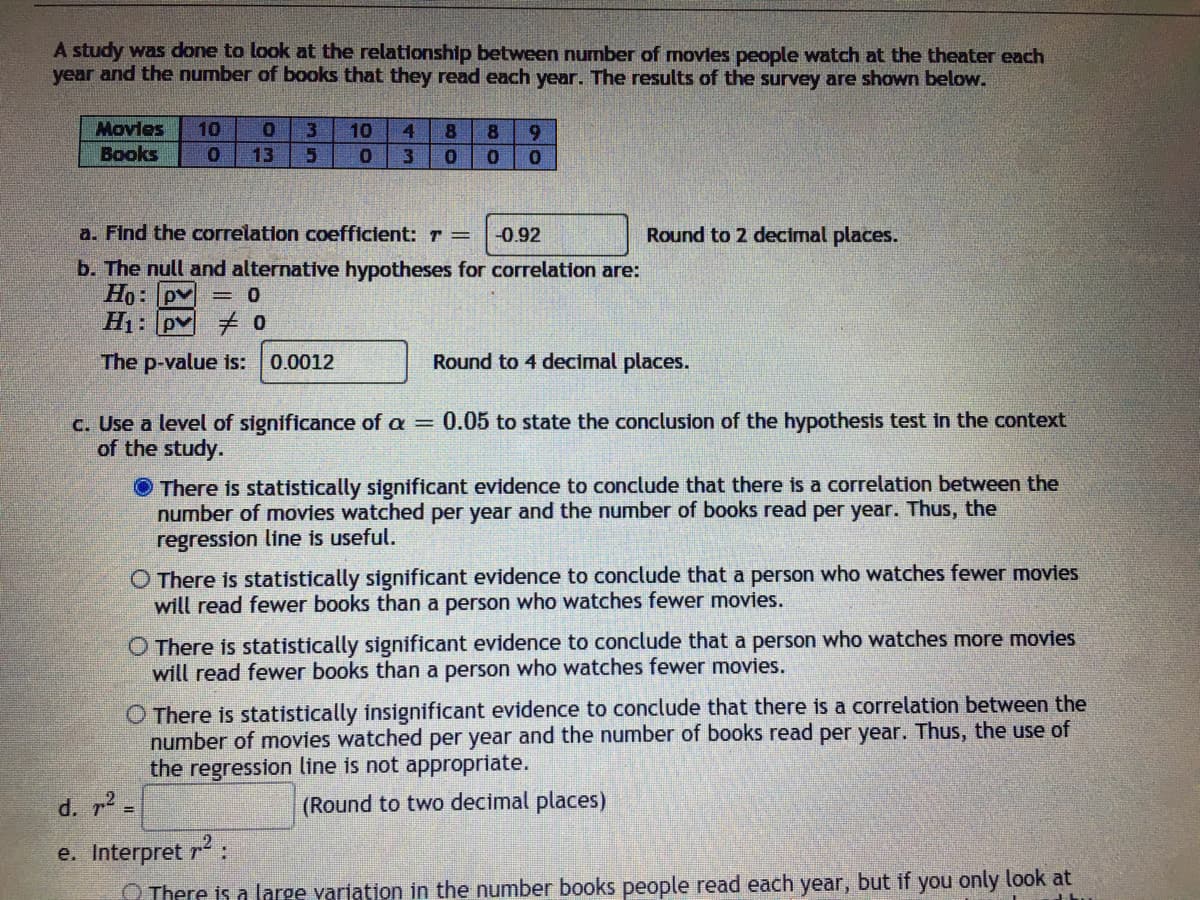
Transcribed Image Text:A study was done to look at the relationship between number of movles people watch at the theater each
year and the number of books that they read each year. The results of the survey are shown below.
Movies
10
10
4.
9.
Books
13
3
a. Find the correlation coefficient: T =
-0.92
Round to 2 decimal places.
b. The null and alternative hypotheses for correlation are:
Ho: pv = 0
H1: pv 0
The p-value is:
0.0012
Round to 4 decimal places.
C. Use a level of significance of a = 0.05 to state the conclusion of the hypothesis test in the context
of the study.
O There is statistically significant evidence to conclude that there is a correlation between the
number of movies watched per year and the number of books read per year. Thus, the
regression line is useful.
O There is statistically significant evidence to conclude that a person who watches fewer movies
will read fewer books than a person who watches fewer movies.
O There is statistically significant evidence to conclude that a person who watches more movies
will read fewer books than a person who watches fewer movies.
O There is statistically insignificant evidence to conclude that there is a correlation between the
number of movies watched per year and the number of books read per year. Thus, the use of
the regression line is not appropriate.
d. r2 =
(Round to two decimal places)
e. Interpret r:
O There is a large variation in the number books people read each year, but if you only look at
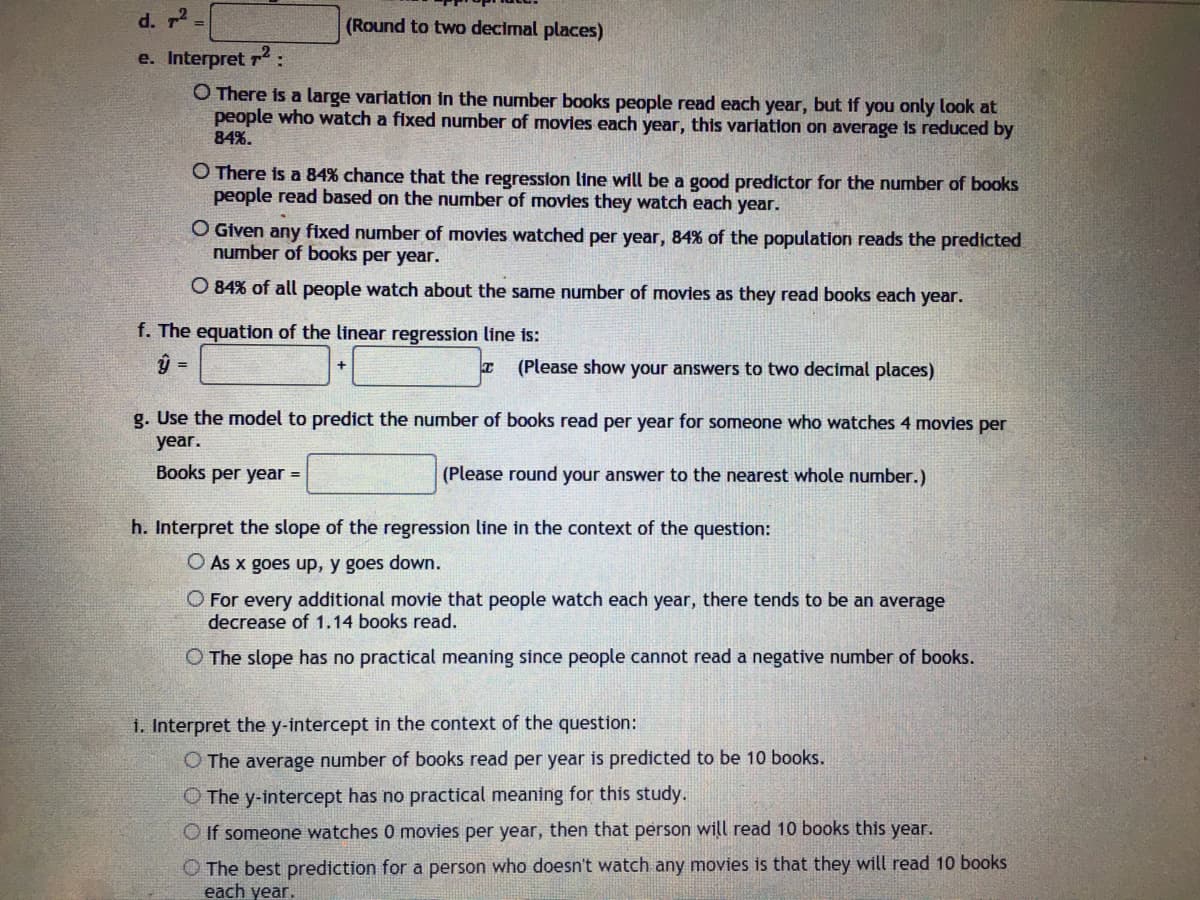
Transcribed Image Text:d. r2
(Round to two decimal places)
e. Interpret r2 :
O There is a large variation in the number books people read each year, but if you only look at
people who watch a fixed number of movies each year, this variation on average is reduced by
84%.
O There is a 84% chance that the regression line will be a good predictor for the number of books
people read based on the number of movies they watch each year.
O Given any fixed number of movies watched per year, 84% of the population reads the predicted
number of books per year.
O 84% of all people watch about the same number of movies as they read books each year.
f. The equation of the linear regression line is:
=
(Please show your answers to two decimal places)
g. Use the model to predict the number of books read per year for someone who watches 4 movies per
year.
Books per year =
(Please round your answer to the nearest whole number.)
h. Interpret the slope of the regression line in the context of the question:
O As x goes up, y goes down.
O For every additional movie that people watch each year, there tends to be an average
decrease of 1.14 books read.
O The slope has no practical meaning since people cannot read a negative number of books.
i. Interpret the y-intercept in the context of the question:
O The average number of books read per year is predicted to be 10 books.
O The y-intercept has no practical meaning for this study.
O If someone watches 0 movies per year, then that person will read 10 books this year.
O The best prediction for a person who doesn't watch any movies is that they will read 10 books
each year.
Expert Solution
This question has been solved!
Explore an expertly crafted, step-by-step solution for a thorough understanding of key concepts.

Step by step
Solved in 2 steps with 4 images

Knowledge Booster


Learn more about
Need a deep-dive on the concept behind this application? Look no further. Learn more about this topic, statistics and related others by exploring similar questions and additional content below.Recommended textbooks for you
Glencoe Algebra 1, Student Edition, 9780079039897…
Algebra
ISBN:
9780079039897
Author:
Carter
Publisher:
McGraw Hill
Glencoe Algebra 1, Student Edition, 9780079039897…
Algebra
ISBN:
9780079039897
Author:
Carter
Publisher:
McGraw Hill