The following table shows the number of years of work experience and the crime rate ratings for selected US cities: X: Years of Work Experience 11 15 12 25 20 40 Y: Crime Rate Ratings 52 41 45 15 20 15 a. Determine the Pearson's Coefficient of Correlation for the given data. Answer rounded to two decimal places
The following table shows the number of years of work experience and the crime rate ratings for selected US cities: X: Years of Work Experience 11 15 12 25 20 40 Y: Crime Rate Ratings 52 41 45 15 20 15 a. Determine the Pearson's Coefficient of Correlation for the given data. Answer rounded to two decimal places

Glencoe Algebra 1, Student Edition, 9780079039897, 0079039898, 2018
18th Edition
ISBN:9780079039897
Author:Carter
Publisher:Carter
Chapter4: Equations Of Linear Functions
Section4.5: Correlation And Causation
Problem 23PFA

Related questions
Question
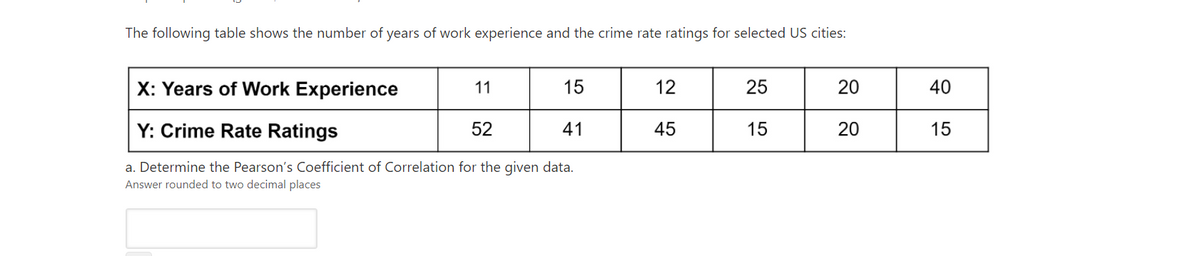
Transcribed Image Text:The following table shows the number of years of work experience and the crime rate ratings for selected US cities:
X: Years of Work Experience
11
15
12
25
20
40
Y: Crime Rate Ratings
52
41
45
15
20
15
a. Determine the Pearson's Coefficient of Correlation for the given data.
Answer rounded to two decimal places
Expert Solution
This question has been solved!
Explore an expertly crafted, step-by-step solution for a thorough understanding of key concepts.

Step by step
Solved in 2 steps with 4 images

Recommended textbooks for you
Glencoe Algebra 1, Student Edition, 9780079039897…
Algebra
ISBN:
9780079039897
Author:
Carter
Publisher:
McGraw Hill
Glencoe Algebra 1, Student Edition, 9780079039897…
Algebra
ISBN:
9780079039897
Author:
Carter
Publisher:
McGraw Hill