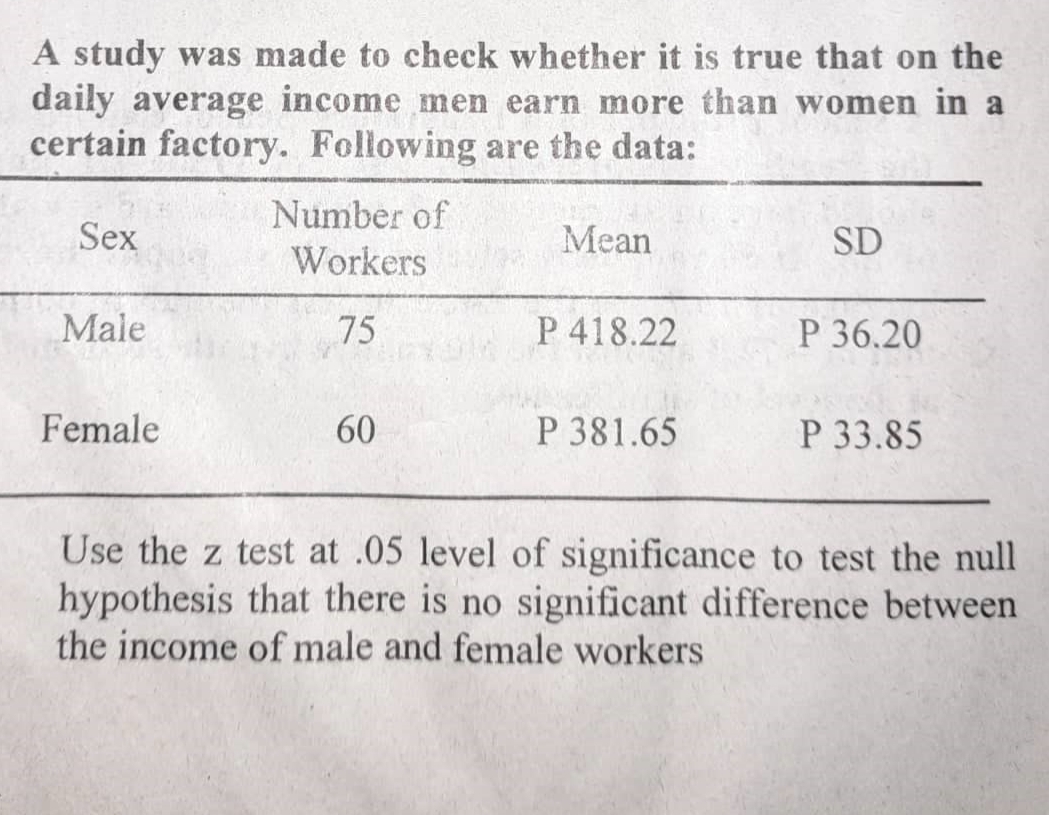
A study was made to check whether it is true that on the daily average income men earn more than women in a certain factory. Following are the data: Number of Sex Mean SD Workers Male 75 P 418.22 P 36.20 Female 60 P 381.65 P 33.85 Use the z test at .05 level of significance to test the null hypothesis that there is no significant difference between the income of male and female workers


Q: It is suspected that the environmental temperature at which batteries were tested, six at each of…
A: The data shows the environmental temperatures at which batteries were tested for five temperatures.
Q: The following data were obtained from an independent-measures research study comparing three…
A: State the hypotheses. That is, there is no significant mean differences among the treatments. That…
Q: A professor at a large university believes that work-study students work an average of 15 hours each…
A:
Q: In a survey of smartphone usage, randomly selected users were asked to record their talk tíme in…
A: The test statistic can be calculated using following formula: t = x-usnwhere, x = sample meanu =…
Q: A random sample of 10 independent healthy people showed the body temperatures given below (in…
A: here mean = ∑xn=983.310 = 98.3 sample standard deviation = ∑(xi-x)2n-1 = 0.8486 since we donot know…
Q: 12. The following data were obtained from an inde- pendent-measures research study comparing three…
A: Solution: 12. State the hypotheses. Null hypothesis: H0: There is no significant mean difference…
Q: Many consumers pay careful attention to stated nutritional contents on pack- aged foods when making…
A:
Q: A sales manager for a large department store believes that customer spending per visit with a sale…
A:
Q: group of six individuals with high cholesterol levels were given a new diet designed to lower…
A:
Q: The following data were obtained from an independent-measures research study comparing three…
A:
Q: The owner of a gasoline station wants to study gasoline purchasing habits by motorists at his…
A: We have given that Sample size n =55 Sample mean = 11 Standard deviation =3.3
Q: The following data were obtained from an independent-measures research study comparing three…
A:
Q: market research firm used a sample of individuals to rate the purchase potential of a particular…
A: Given that Sample size n =8 Level of significance =alpha =0.05 Degree of freedom =df = n-1=7
Q: In an experiment to study the dependence of hypertension on smoking habits, the following data were…
A:
Q: alue for a right-tailed test using a significance level of ?=0.02.α=0.02
A: To find the z value, use the standard normal table to find the z-score which cuts off an area of…
Q: Many consumers pay careful attention to stated nutritional contents on packaged foods when making…
A: The test hypotheses are shown below:Null hypothesis:H0: μ = 240.Alternative hypothesis:H1: μ ≠ 240.
Q: A researcher working for the Ray-Ban Corporation decides to perform a hypothesis test to investigate…
A: Hypothesis: Hypothesis is an assumption about the parameter of the population which will be made on…
Q: A Michigan study concerning preference for outdoor activities used a questionnaire with a six-point…
A: We have given that Sample size n1= 44 , n2= 52 Sample mean xbar1 = 4.9 , xbar2 = 5.7 Known standard…
Q: The following data are from an experiment designed to investigate the perception of corporate…
A: For the given data perform Anova: Single Factor we get
Q: A Z-test for single population mean is conducted with Ha: u < 10, at significance level of 0.05, The…
A:
Q: The following data are from an experiment designed to investigate the perception of corporate…
A: An ANOVA is a statistical tool used to test the population mean of two or more than two groups.…
Q: A Michigan study concerning preference for outdoor activities used a questionnaire with a six-point…
A: Given: n1 = 47 X1 = 4.9 σ1 = 1.2 n2 = 43 X2 = 5.5 σ2 = 1.4 α = 0.05 Formula Used: Test-statistic Z =…
Q: In a survey of smartphone usage, randomly selected users were asked to record their talk time in…
A:
Q: Treatments Person Person II Totals P = 6 P = 9 P = 18 P = 12 EX = 350 A 2 4 B 3. 6. N = 15 7 8 G =…
A: ANOVA: The analysis of variance (ANOVA) is used to determine whether there are any statistically…
Q: Provided below is the obtained value for the test statistic for a one-mean z-test. Determine the…
A: a) It is given that the z test statistic for two tailed test is –2.04.
Q: A random sample of six advertisements taken from Scientific American had the following fog indices…
A: Ho : σ12=σ22 US H1.σ12 ±σ22Let X be sample for scientific American following fog Indices…
Q: A study was done on proctored and nonproctored tests. The results are shown in the table. Assume…
A:
Q: In a survey of smartphone usage, randomly selected users were asked to record their talk time in…
A: Given, Claim: The mean talk time for Smartphone users is less than 14 minutes per day. The…
Q: A study was done on proctored and nonproctored tests. The results are shown in the table. Assume…
A:
Q: In their 2003 and 2008 studies on how long wireless customers have to spend on hold before speaking…
A: Let μ1 denotes the mean time on hold for 2008 and μ2 denotes the mean time on hold for 2003.…
Q: A case-control (or retrospective) study was conducted to investigate a relationship between the…
A:
Q: Use the pulse rates in beats per minute (bpm) of a random sample of adult females listed in the…
A: x¯ = 65.05 s = 22.131 n = 50
Q: Many consumers pay careful attention to stated nutritional contents on packaged foods when making…
A: The test hypotheses are shown below:Null hypothesis:H0: μ = 240.Alternative hypothesis:H1: μ ≠ 240.
Q: Listed below are heights (cm) randomly selected from the sample of women and heights cm) randomly…
A: State the hypotheses. That is, there is no evidence to conclude that the women have the heights…
Q: The following are airborne times (in minutes) for 10 randomly selected flights from San Francisco to…
A:
Q: Is the length of time of unemployment related to the type of industry? A random sample of unemployed…
A: The row and column totals are, Less than 5 weeks 5-14 weeks 15-26 weeks Total Transportation…
Q: market research firm used a sample of individuals to rate the purchase potential of a particular…
A: Given that Level of significance =alpha =0.05 Sample size n =8 Degree of freedom =df= n-1
Q: A cereal company claims that the mean weight of the cereal in its packets is 14 oz. The weight (in…
A: Given that n = 8 , μ = 14 The data are 14.6 , 13.8 , 14.1 , 13.7 , 14.0 , 14.4 , 13.6 , 14.2
Q: There is a claim that playing e-sport increase food intake. The following table (Table 2) shows data…
A:
Q: A Michigan study concerning preference for outdoor activities used a questionnaire with a six-point…
A: Hello. Since your question has multiple sub-parts, we will solve first three sub-parts for you. If…
Q: An agriculturist claims that she has cultivated a new variety of orange that has a significantly…
A: We have to perform equality test for variance.
Q: A case-control (or retrospective) study was conducted to investigate a relationship between the…
A:
Q: A researcher wanted to determent mine if there was a significant difference in fat content between…
A: For the above problem we should use t-test for difference of means.
Q: The null and alternative hypotheses are: Ho : Ha = 0 H1 : Ha + 0 The following paired observations…
A:
Q: The Wall Street Journal published a study in May 2019 claiming that it was hard to find CEOS that…
A: One sample t-test: The one -sample t -test is used to determine whether the mean of sample differs…
Q: The following data lists the ages of a random selection of actresses when they won an award in the…
A: From the provided information, Sample size (n) = 10 Level of significance (α) = 0.05
Q: A researcher was interested in comparing the salaries of female and male employees at a particular…
A: Given: Salaries in dollars Female Male 495 722 760 562 556 880 904 520 520 500 1005…
Q: The following data are from a study comparing three groups of college students. The information…
A: Given data
Q: A Michigan study concerning preference for outdoor activities used a questionnaire with a six-point…
A: a) The the level of significance is 0.05. Null hypothesis: H0: μ1=μ2 Alternative hypothesis: HA:…
Q: A market research firm used a sample of individuals to rate the purchase potential of a particular…
A: We want to find the t statistic for paired


Trending now
This is a popular solution!

Step by step
Solved in 3 steps


- A random sample of Engineering and Architecture students of a university were interviewed to determine if there is an association between study habits and academic performance. The results were tabulated below. Students Favourable Neutral Unfavourable Engineering 80 60 70 Architecture 100 50 70 Test the hypothesis that there is no significant difference between the study habits and academic performance using a 0.05 level of significance.A city is collecting data on two neighborhoods, one low income and one middle income, to see whether or not their residents would support an increase in local sales tax to pay for more city services. The city wishes to see if there is evidence to show that the first neighborhood (low income) has a lower level of support for the tax compared to the second neighborhood (middle income).You wish to test the following claim (HaHa) at a significance level of α=0.002 Ho:p1=p2 Ha:p1<p2You obtain a sample from the first population with 219 successes and 131 failures. You obtain a sample from the second population with 177 successes and 53 failures.What is the test statistic for this sample? (Report answer accurate to three decimal places.)test statistic = What is the p-value for this sample? (Report answer accurate to four decimal places.)p-value = The p-value is... less than (or equal to) αα greater than αα This test statistic leads to a decision to... reject the null accept…A Michigan study concerning preference for outdoor activities used a questionnaire with a six-point Likert-type response in which 1 designated "not important" and 6 designated "extremely important." A random sample of n1 = 47 adults were asked about fishing as an outdoor activity. The mean response was x1 = 4.9. Another random sample of n2 = 48 adults were asked about camping as an outdoor activity. For this group, the mean response was x2 = 4.2. From previous studies, it is known that σ1 = 1.4 and σ2 = 1.8. Does this indicate a difference (either way) regarding preference for camping versus preference for fishing as an outdoor activity? Use a 5% level of significance.Note: A Likert scale usually has to do with approval of or agreement with a statement in a questionnaire. For example, respondents are asked to indicate whether they "strongly agree," "agree," "disagree," or "strongly disagree" with the statement. What is the value of the sample test statistic? (Test the difference μ1 −…
- A Michigan study concerning preference for outdoor activities used a questionnaire with a six-point Likert-type response in which 1 designated "not important" and 6 designated "extremely important." A random sample of n1 = 45 adults were asked about fishing as an outdoor activity. The mean response was x1 = 4.9. Another random sample of n2 = 55 adults were asked about camping as an outdoor activity. For this group, the mean response was x2 = 4.0. From previous studies, it is known that σ1 = 1.5 and σ2 = 2.0. Does this indicate a difference (either way) regarding preference for camping versus preference for fishing as an outdoor activity? Use a 5% level of significance. Note: A Likert scale usually has to do with approval of or agreement with a statement in a questionnaire. For example, respondents are asked to indicate whether they "strongly agree," "agree," "disagree," or "strongly disagree" with the statement. (a) What is the level of significance? What is the value of the sample…A Michigan study concerning preference for outdoor activities used a questionnaire with a six-point Likert-type response in which 1 designated "not important" and 6 designated "extremely important." A random sample of n1 = 42 adults were asked about fishing as an outdoor activity. The mean response was x1 = 4.9. Another random sample of n2 = 55 adults were asked about camping as an outdoor activity. For this group, the mean response was x2 = 4.3. From previous studies, it is known that σ1 = 1.3 and σ2 = 1.2. Note: A Likert scale usually has to do with approval of or agreement with a statement in a questionnaire. For example, respondents are asked to indicate whether they "strongly agree," "agree," "disagree," or "strongly disagree" with the statement. (a) What is the value of the sample test statistic? Compute the corresponding z or t value as appropriate. (Test the difference μ1 − μ2. Round your answer to two decimal places.)(b) Find (or estimate) the P-value. (Round your answer to…On snow-covered roads, winter tires enable a car to stop in a shorter distance than if summer tires were installed. In terms of the additive model for one-way ANOVA, and for an experiment in which the mean stopping distances on a snow-covered road are measured for each of four brands of winter tires. If the data are as shown in Sheet 48, what conclusion would be reached at the 0.01 level of significance? Shett 48 Supplier A 517 484 463 452 502 447 481 500 485 566 Supplier B 479 499 488 430 482 457 424 488 526 455 Supplier C 435 443 480 465 435 430 465 514 463 510 Supplier D 526 537 443 505 468 533 481 477 490 470 Select one: a) p-value = 0.28 greater than 0.05, the average distance is different for at list two tires b) F stat = 1.86, F crit = 4.38, not enough evidence to claim that the average distance is different for at list two tires c) F ratio = 4.38, not enough evidence to claim that the average distance is different for at list two tires d) F stat = 0.68, F…
- To test the fairness of law enforcement in its area, a local citizens’ group wants to know whether women and men are unequally likely to get speeding tickets. Four hundred randomly selected adults were phoned and asked whether or not they had been cited for speeding in the last year. Using the results in the following table and a 0.10 level of significance, test the claim of the citizens’ group. Let men be Population 1 and let women be Population 2. Speeding Tickets Ticketed Not Ticketed Men 12 183 Women 30 175 Copy Data Step 2 of 3 : Compute the value of the test statistic. Round your answer to two decimal places.A Michigan study concerning preference for outdoor activities used a questionnaire with a six-point Likert-type response in which 1 designated "not important" and 6 designated "extremely important." A random sample of n1 = 44 adults were asked about fishing as an outdoor activity. The mean response was x1 = 4.9. Another random sample of n2 = 47 adults were asked about camping as an outdoor activity. For this group, the mean response was x2 = 5.6. From previous studies, it is known that σ1 = 1.2 and σ2 = 2.0. Does this indicate a difference (either way) regarding preference for camping versus preference for fishing as an outdoor activity? Use a 5% level of significance. 1. What is the value of the sample test statistic? (Test the difference μ1 − μ2. Round your answer to two decimal places.) 2. Find (or estimate) the P-value. (Round your answer to four decimal places.)A Michigan study concerning preference for outdoor activities used a questionnaire with a six-point Likert-type response in which 1 designated "not important" and 6 designated "extremely important." A random sample of n1 = 46 adults were asked about fishing as an outdoor activity. The mean response was x1 = 4.9. Another random sample of n2 = 48 adults were asked about camping as an outdoor activity. For this group, the mean response was x2 = 5.8. From previous studies, it is known that σ1 = 1.8 and σ2 = 1.9. Does this indicate a difference (either way) regarding preference for camping versus preference for fishing as an outdoor activity? Use a 5% level of significance.Note: A Likert scale usually has to do with approval of or agreement with a statement in a questionnaire. For example, respondents are asked to indicate whether they "strongly agree," "agree," "disagree," or "strongly disagree" with the statement. (a) What is the level of significance? What is the value of the sample…