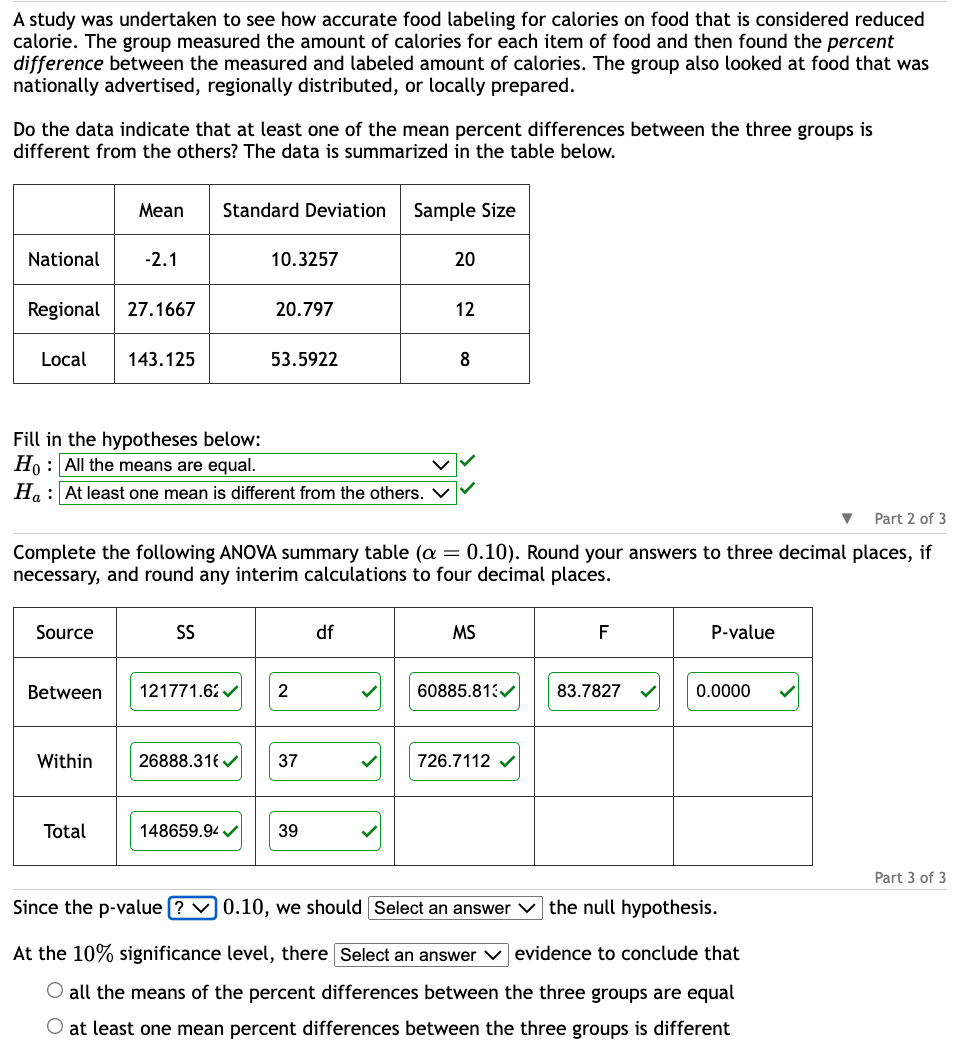
A study was undertaken to see how accurate food labeling for calories on food that is considered reduced calorie. The group measured the amount of calories for each item of food and then found the percent difference between the measured and labeled amount of calories. The group also looked at food that was nationally advertised, regionally distributed, or locally prepared. Do the data indicate that at least one of the mean percent differences between the three groups is different from the others? The data is summarized in the table below. National Regional Local Source Between Mean Standard Deviation Within -2.1 Total 27.1667 143.125 Fill in the hypotheses below: Ho All the means are equal. Ha: At least one mean is different from the others. 10.3257 SS 20.797 53.5922 Part 2 of Complete the following ANOVA summary table (a = 0.10). Round your answers to three decimal places, if necessary, and round any interim calculations to four decimal places. 148659.94✔ 121771.62✓ 2 26888.316✔ 37 Sample Size 39 df 20 12 8 MS 60885.813✔ 726.7112 ✓ F 83.7827 P-value 0.0000 Since the p-value ? ✓0.10, we should Select an answer the null hypothesis. At the 10% significance level, there Select an answer evidence to conclude that O all the means of the percent differences between the three groups are equal O at least one mean percent differences between the three groups is different ▼ Part 3 of
A study was undertaken to see how accurate food labeling for calories on food that is considered reduced calorie. The group measured the amount of calories for each item of food and then found the percent difference between the measured and labeled amount of calories. The group also looked at food that was nationally advertised, regionally distributed, or locally prepared. Do the data indicate that at least one of the mean percent differences between the three groups is different from the others? The data is summarized in the table below. National Regional Local Source Between Mean Standard Deviation Within -2.1 Total 27.1667 143.125 Fill in the hypotheses below: Ho All the means are equal. Ha: At least one mean is different from the others. 10.3257 SS 20.797 53.5922 Part 2 of Complete the following ANOVA summary table (a = 0.10). Round your answers to three decimal places, if necessary, and round any interim calculations to four decimal places. 148659.94✔ 121771.62✓ 2 26888.316✔ 37 Sample Size 39 df 20 12 8 MS 60885.813✔ 726.7112 ✓ F 83.7827 P-value 0.0000 Since the p-value ? ✓0.10, we should Select an answer the null hypothesis. At the 10% significance level, there Select an answer evidence to conclude that O all the means of the percent differences between the three groups are equal O at least one mean percent differences between the three groups is different ▼ Part 3 of

Glencoe Algebra 1, Student Edition, 9780079039897, 0079039898, 2018
18th Edition
ISBN:9780079039897
Author:Carter
Publisher:Carter
Chapter10: Statistics
Section10.6: Summarizing Categorical Data
Problem 23PPS

Related questions
Question
Transcribed Image Text:A study was undertaken to see how accurate food labeling for calories on food that is considered reduced
calorie. The group measured the amount of calories for each item of food and then found the percent
difference between the measured and labeled amount of calories. The group also looked at food that was
nationally advertised, regionally distributed, or locally prepared.
Do the data indicate that at least one of the mean percent differences between the three groups is
different from the others? The data is summarized in the table below.
National
Local
Regional 27.1667
Source
Mean Standard Deviation
Between
-2.1
Within
Total
143.125
Fill in the hypotheses below:
Ho All the means are equal.
Ha: At least one mean is different from the others.
10.3257
SS
20.797
121771.62✓
53.5922
Part 2 of 3
Complete the following ANOVA summary table (a = 0.10). Round your answers to three decimal places, if
necessary, and round any interim calculations to four decimal places.
2
26888.316✓✔ 37
Sample Size
148659.94✓✔ 39
df
20
12
8
MS
F
60885.813✔ 83.7827
726.7112 ✓
P-value
0.0000
Since the p-value ? 0.10, we should Select an answer the null hypothesis.
At the 10% significance level, there Select an answer evidence to conclude that
O all the means of the percent differences between the three groups are equal
O at least one mean percent differences between the three groups is different
Part 3 of 3
Expert Solution
This question has been solved!
Explore an expertly crafted, step-by-step solution for a thorough understanding of key concepts.

Step by step
Solved in 2 steps

Recommended textbooks for you
Glencoe Algebra 1, Student Edition, 9780079039897…
Algebra
ISBN:
9780079039897
Author:
Carter
Publisher:
McGraw Hill

Big Ideas Math A Bridge To Success Algebra 1: Stu…
Algebra
ISBN:
9781680331141
Author:
HOUGHTON MIFFLIN HARCOURT
Publisher:
Houghton Mifflin Harcourt

Holt Mcdougal Larson Pre-algebra: Student Edition…
Algebra
ISBN:
9780547587776
Author:
HOLT MCDOUGAL
Publisher:
HOLT MCDOUGAL
Glencoe Algebra 1, Student Edition, 9780079039897…
Algebra
ISBN:
9780079039897
Author:
Carter
Publisher:
McGraw Hill
Big Ideas Math A Bridge To Success Algebra 1: Stu…
Algebra
ISBN:
9781680331141
Author:
HOUGHTON MIFFLIN HARCOURT
Publisher:
Houghton Mifflin Harcourt
Holt Mcdougal Larson Pre-algebra: Student Edition…
Algebra
ISBN:
9780547587776
Author:
HOLT MCDOUGAL
Publisher:
HOLT MCDOUGAL