Research is conducted regarding the average age at retirement for four careers. A total of 700 people who recently retired are randomly selected. The resulting data are displayed in the contingency table below. The research question is: Are there differences in the retirement age for the four career types? a. What statistical test is most appropriate to answer this question? Identify the relevant assumptions and conditions and state how these have or have not been met b. Write an appropriate null and alternative hypothesis


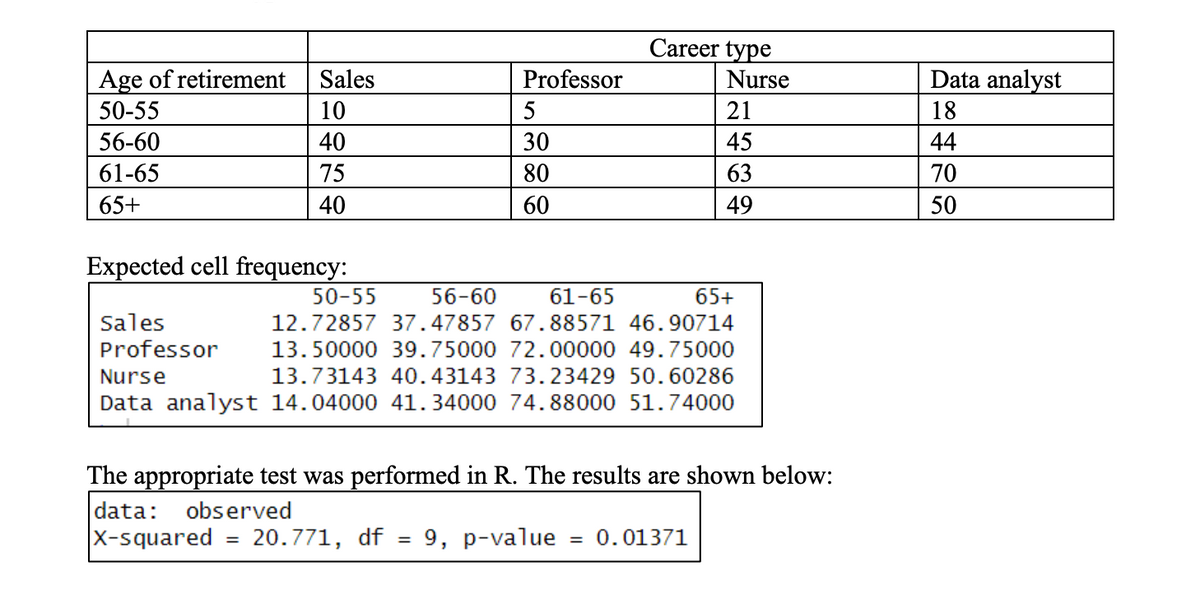
Research is conducted regarding the average age at retirement for four careers. A total of 700 people who recently retired are randomly selected. The resulting data are displayed in the contingency table below. The research question is: Are there differences in the retirement age for the four career types?
a. What statistical test is most appropriate to answer this question? Identify the relevant assumptions and conditions and state how these have or have not been met
b. Write an appropriate null and alternative hypothesis for this question.
c.Assuming a 5% significance level, what is the appropriate decision for this test and why?
d. Write a one-sentence conclusion statement
e.Examine the standardized residuals presented in the table below and discuss any significant results in 2-4 sentences


Trending now
This is a popular solution!

Step by step
Solved in 3 steps with 3 images

