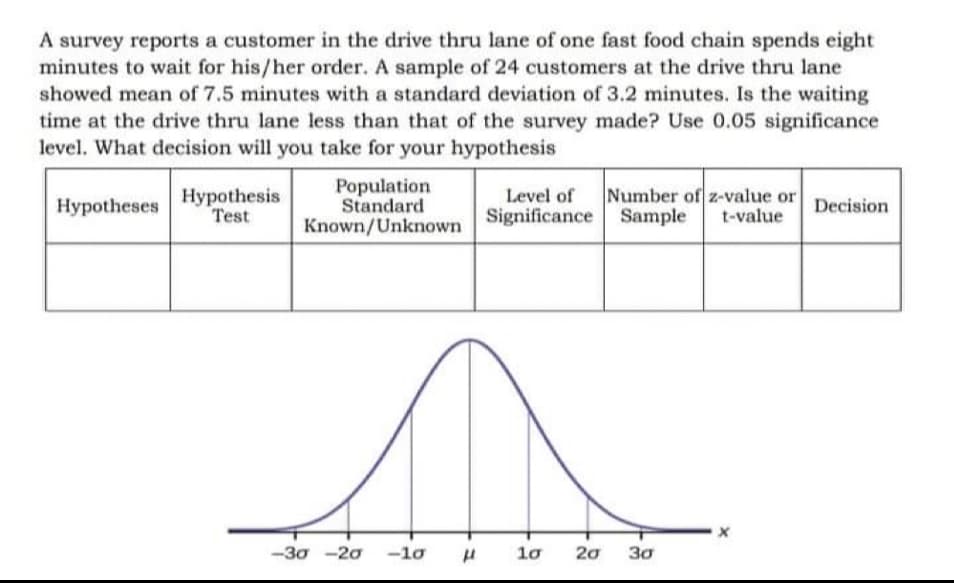
A survey reports a customer in the drive thru lane of one fast food chain spends eight minutes to wait for his/her order. A sample of 24 customers at the drive thru lane showed mean of 7.5 minutes with a standard deviation of 3.2 minutes. Is the waiting time at the drive thru lane less than that of the survey made? Use 0.05 significance level. What decision will you take for your hypothesis Population Standard Number of z-value or Sample Level of Hypotheses Hypothesis Test Decision t-value Known/Unknown Significance
A survey reports a customer in the drive thru lane of one fast food chain spends eight minutes to wait for his/her order. A sample of 24 customers at the drive thru lane showed mean of 7.5 minutes with a standard deviation of 3.2 minutes. Is the waiting time at the drive thru lane less than that of the survey made? Use 0.05 significance level. What decision will you take for your hypothesis Population Standard Number of z-value or Sample Level of Hypotheses Hypothesis Test Decision t-value Known/Unknown Significance

MATLAB: An Introduction with Applications
6th Edition
ISBN:9781119256830
Author:Amos Gilat
Publisher:Amos Gilat
Chapter1: Starting With Matlab
Section: Chapter Questions
Problem 1P

Related questions
Question
100%
Direction:
Read the following problems and place all your answer on a separate sheet following the given table below each problem. Draw the normal curve and show the rejection region. for each problem and make a decision for your hypothesis.
Transcribed Image Text:A survey reports a customer in the drive thru lane of one fast food chain spends eight
minutes to wait for his/her order. A sample of 24 customers at the drive thru lane
showed mean of 7.5 minutes with a standard deviation of 3.2 minutes. Is the waiting
time at the drive thru lane less than that of the survey made? Use 0.05 significance
level. What decision will you take for your hypothesis
Нурothesis
Test
Population
Standard
Known/Unknown Significance Sample
Number of z-value or
t-value
Level of
Hypotheses
Decision
-30 -20 -lo
1o
20
30
Expert Solution
This question has been solved!
Explore an expertly crafted, step-by-step solution for a thorough understanding of key concepts.

Step by step
Solved in 3 steps with 2 images

Recommended textbooks for you
MATLAB: An Introduction with Applications
Statistics
ISBN:
9781119256830
Author:
Amos Gilat
Publisher:
John Wiley & Sons Inc

Probability and Statistics for Engineering and th…
Statistics
ISBN:
9781305251809
Author:
Jay L. Devore
Publisher:
Cengage Learning

Statistics for The Behavioral Sciences (MindTap C…
Statistics
ISBN:
9781305504912
Author:
Frederick J Gravetter, Larry B. Wallnau
Publisher:
Cengage Learning
MATLAB: An Introduction with Applications
Statistics
ISBN:
9781119256830
Author:
Amos Gilat
Publisher:
John Wiley & Sons Inc
Probability and Statistics for Engineering and th…
Statistics
ISBN:
9781305251809
Author:
Jay L. Devore
Publisher:
Cengage Learning
Statistics for The Behavioral Sciences (MindTap C…
Statistics
ISBN:
9781305504912
Author:
Frederick J Gravetter, Larry B. Wallnau
Publisher:
Cengage Learning

Elementary Statistics: Picturing the World (7th E…
Statistics
ISBN:
9780134683416
Author:
Ron Larson, Betsy Farber
Publisher:
PEARSON

The Basic Practice of Statistics
Statistics
ISBN:
9781319042578
Author:
David S. Moore, William I. Notz, Michael A. Fligner
Publisher:
W. H. Freeman

Introduction to the Practice of Statistics
Statistics
ISBN:
9781319013387
Author:
David S. Moore, George P. McCabe, Bruce A. Craig
Publisher:
W. H. Freeman