A survey was conducted to determine whether a driver's propensity to engage in road rage is related to his or her income. The mean road rage scores of drivers in three income groups were labeled A, B, and C. Use the partial ANOVA summary table given below to complete parts a through c below. Source Road Rage Score Fvalue 21.96 P-value 0.001 2 Error 72 Total a. What conclusion can you draw from the ANOVA results? Identify the null and alternate hypotheses for the test given in the ANOVA results. He H What conclusion can you draw from the ANOVA results? V the null hypothesis. There is V evidence to conclude that V of the means are significantly different from each other. b. A multiple comparisons of means procedure was applied to the data using an experimentwise error rate of 0.05. Explain what the O.05 means. Choose the correct answer below. O A. The probability of claiming at least 2 means are different when they are not is 0.05. O B. The probability of claiming at least 2 means are different when they are not is 0.95. OC. The probability of claiming at least 2 means are not different when they are is 0.95. O D. The probability of claiming at least 2 means are not different when they are is 0.05. c. The multiple comparisons yielded the following results. What conclusion can you draw? Mean 4.62 5.09 5.16 Group A B C Which of the groups have means that are significantly different? Select all that apply. OA. A and C O B. Aand B Oc. Band C O D. None of the means are significantly different.
A survey was conducted to determine whether a driver's propensity to engage in road rage is related to his or her income. The mean road rage scores of drivers in three income groups were labeled A, B, and C. Use the partial ANOVA summary table given below to complete parts a through c below. Source Road Rage Score Fvalue 21.96 P-value 0.001 2 Error 72 Total a. What conclusion can you draw from the ANOVA results? Identify the null and alternate hypotheses for the test given in the ANOVA results. He H What conclusion can you draw from the ANOVA results? V the null hypothesis. There is V evidence to conclude that V of the means are significantly different from each other. b. A multiple comparisons of means procedure was applied to the data using an experimentwise error rate of 0.05. Explain what the O.05 means. Choose the correct answer below. O A. The probability of claiming at least 2 means are different when they are not is 0.05. O B. The probability of claiming at least 2 means are different when they are not is 0.95. OC. The probability of claiming at least 2 means are not different when they are is 0.95. O D. The probability of claiming at least 2 means are not different when they are is 0.05. c. The multiple comparisons yielded the following results. What conclusion can you draw? Mean 4.62 5.09 5.16 Group A B C Which of the groups have means that are significantly different? Select all that apply. OA. A and C O B. Aand B Oc. Band C O D. None of the means are significantly different.

Glencoe Algebra 1, Student Edition, 9780079039897, 0079039898, 2018
18th Edition
ISBN:9780079039897
Author:Carter
Publisher:Carter
Chapter10: Statistics
Section10.3: Measures Of Spread
Problem 1GP

Related questions
Question
6
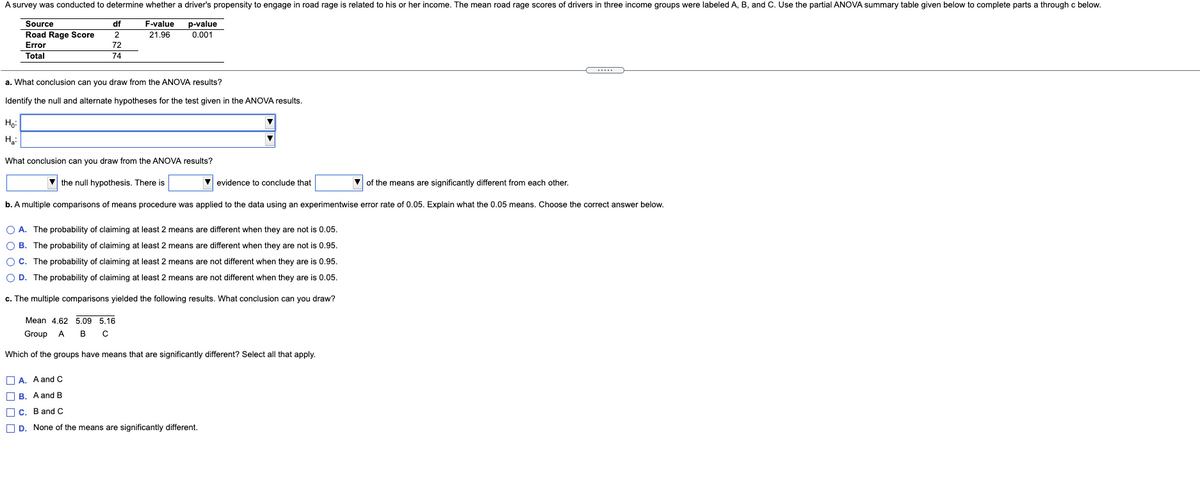
Transcribed Image Text:A survey was conducted to determine whether a driver's propensity to engage in road rage is related to his or her income. The mean road rage scores of drivers in three income groups were labeled A, B, and C. Use the partial ANOVA summary table given below to complete parts a through c below.
F-value
p-value
0.001
Source
df
Road Rage Score
21.96
Error
72
Total
74
a. What conclusion can you draw from the ANOVA results?
Identify the null and alternate hypotheses for the test given in the ANOVA results.
Họ:
What conclusion can you draw from the ANOVA results?
V the null hypothesis. There is
evidence to conclude that
of the means are significantly different from each other.
b. A multiple comparisons of means procedure was applied to the data using an experimentwise error rate of 0.05. Explain what the 0.05 means. Choose the correct answer below.
O A. The probability of claiming at least 2 means are different when they are not is 0.05.
O B. The probability of claiming at least 2 means are different when they are not is 0.95.
O C. The probability of claiming at least 2 means are not different when they are is 0.95.
O D. The probability of claiming at least 2 means are not different when they are is 0.05.
c. The multiple comparisons yielded the following results. What conclusion can you draw?
Mean 4.62 5.09 5.16
Group
A
в с
Which of the groups have means that are significantly different? Select all that apply.
O A. A and c
O B. A and B
O c. Band C
O D. None of the means are significantly different.
Expert Solution
This question has been solved!
Explore an expertly crafted, step-by-step solution for a thorough understanding of key concepts.

This is a popular solution!

Trending now
This is a popular solution!

Step by step
Solved in 2 steps with 1 images

Recommended textbooks for you
Glencoe Algebra 1, Student Edition, 9780079039897…
Algebra
ISBN:
9780079039897
Author:
Carter
Publisher:
McGraw Hill

College Algebra (MindTap Course List)
Algebra
ISBN:
9781305652231
Author:
R. David Gustafson, Jeff Hughes
Publisher:
Cengage Learning
Glencoe Algebra 1, Student Edition, 9780079039897…
Algebra
ISBN:
9780079039897
Author:
Carter
Publisher:
McGraw Hill
College Algebra (MindTap Course List)
Algebra
ISBN:
9781305652231
Author:
R. David Gustafson, Jeff Hughes
Publisher:
Cengage Learning