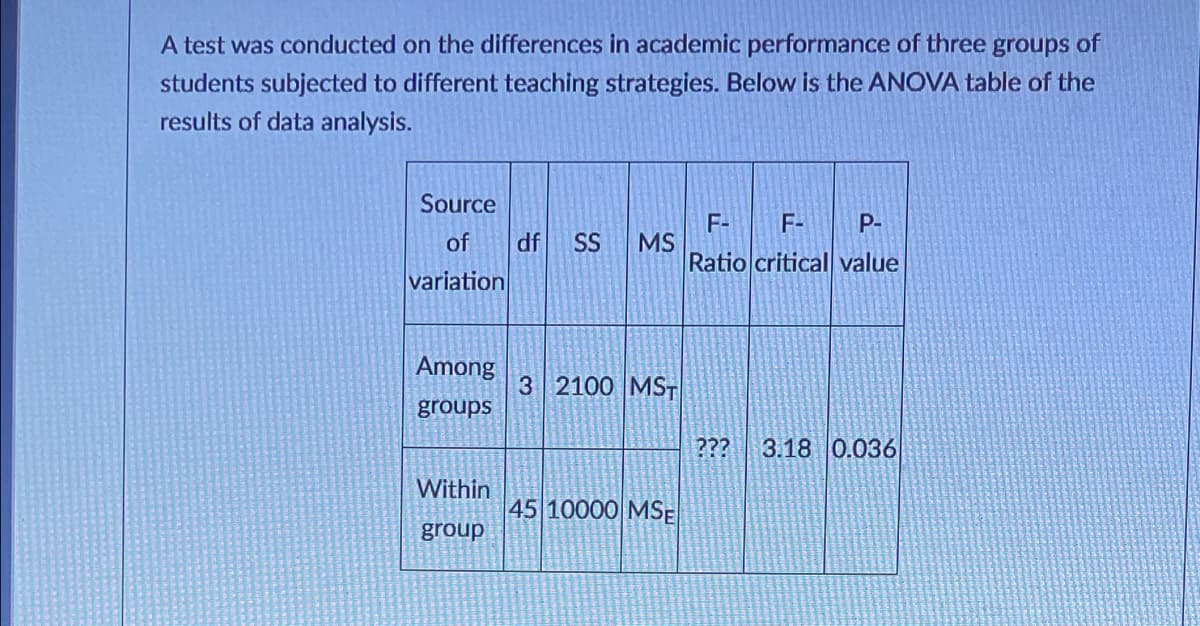
A test was conducted on the differences in academic performance of three groups of students subjected to different teaching strategies. Below is the ANOVA table of the results of data analysis.


Q: fifty-four wild bears were anesthetized, and then their weights and chest sizes were measured and…
A:
Q: To determine if a training program has improved the average performance of trainees if data is…
A: Independent samples are known as the samples that are selected randomly so that the observations…
Q: What is the best correlational test to use in SPSS for a research sample size of 39?
A: A correlation coefficient is a value that shows how closely two sets of measurements are related. It…
Q: Provide an example of a study in which an independent measures ANOVA would be warranted ?
A: Introduction: The ANOVA or analysis of variance is a parametric method of hypothesis testing,…
Q: What is the similarity between one-way ANOVA and a t-test?
A: Answer: A
Q: The alternative hypothesis for an ANOVA states that
A: ANOVA: In one factor ANOVA model only one factor is studied, that is only the effect on one factor…
Q: An ANOVA is used to evaluate the mean differences among three treatment conditions with a sample of…
A: It is given that the number of treatments, K is 3.Total number of observations is (12 x 3) = 36.
Q: When should you use a one-way ANOVA to analyze your data? Distinguish between one–way ANOVA for…
A: ANOVA compares one or more population mean scores with each other on the basis of the sample data;…
Q: Are these samples independent or paired?
A: When the two observations are taken on same individual then the samples are said to be paired.
Q: What is the observed significance level for this test?
A: here given , n= 50 sample mean = 19.4 sample standard deviation = 3.1
Q: What is the key difference between an independent and a dependent samples t-test?
A: Solution-: What is the key difference between an independent and a dependent samples t-test?
Q: If remedial measure is applied to address the problem of multicollinearity in the model, do you…
A: Multicollinearity (MColl) exists when independent variables (IVs) are dependent on each other.
Q: Describe the difference between a two-sample (independent) t-test and an ANOVA (in terms of what…
A: Comparison of two sample t test and ANOVA
Q: Find the critical value for a test for correlation with a significance level of 10% and a sample…
A:
Q: In one-way ANOVA, identify a statistic that measures a. the variation among the sample means. b. the…
A: From the given information, In one-way ANOVA, the required statistics that measures the variation…
Q: A researcher studying psychological well-being between those with depression, anxiety, or mood…
A: Given Information- Number of individuals for each type of psychological well-being are Depression =…
Q: What does the three F ratios in a two-factor ANOVA is based?
A:
Q: w is it used to conclude there is a statistically significant difference between the mean of…
A: The test which gives global assessment for statistical difference for 2 independent means called…
Q: Why would a researcher choose to conduct an One-Way ANOVA rather than multiple independent samples…
A: Solution-: Why would a researcher choose to conduct an One-Way ANOVA rather than multiple…
Q: Use a 0.05 significance level to test the claim that the different samples come from populations…
A: Hello! As you have posted more than 3 sub parts, we are answering the first 3 sub-parts. In case…
Q: Use an ANOVA with α = .05 to determine whether there are any significant differences among the three…
A: Given table represents three treatments with their mean , sum and sum of squares . Now, calculate…
Q: a. Use an ANOVA with a = .05 to determine whether there are significant differences in student judg-…
A: a. The give study shows the scores of judgements of the acceptability of cheating for the students…
Q: The Airline Passenger Association studied the relationship between the number of passengers on a…
A:
Q: What test would be best to use if there was a statistical difference between brands in an…
A: ANOVA : - It is statistical technique to measure the difference in mean between more than 2 groups.…
Q: When doing an ANOVA, you observe large differences in means between groups. Within the ANOVA…
A: ANOVA: It is a statistical method for testing hypotheses regarding the mean difference among two or…
Q: 1. Why should you use ANOVA instead of several t tests to evaluate mean differences when an…
A: As per our guidelines, we are only allowed to answer 1 question per query. T-test and Analysis of…
Q: For a two-way ANOVA, define the following concepts: a. levels of Factor B b. no interaction c. a…
A:
Q: A market researcher is trying to determine whether males differ from females with regard to the…
A: Chi-square test
Q: What is the significance of a z-score?
A: The value of z score tells that how many standard deviations the data is spread away from mean. The…
Q: Justify when and why we should use the Kolmogorov-Smirnov test to statistically analyze data in…
A: Please find the explanation below. Thank you
Q: Below are several research scenarios. Indicate which set of statistical analyses (e.g., ANOVA,…
A: a) Here, we have three groups and we have see if the difference in this groups is significant and…
Q: What does a non-statistical evaluation of the graphs of data for the two-factor experiment suggests?
A:
Q: In one-way ANOVA, the total variation in scores can be divided into two sources ___
A: In general, the total variation in scores can be divided into two sources. They are shown below:
Q: State the one-way ANOVA identity, and interpret its meaning with regard to partitioning the total…
A: One-way ANOVA identity is given below: SST=SSTR+SSE
Q: Given all the information provided: Identify the correlation coefficient, r. r= _____ (round to…
A: Claim : There is a linear correlation between the weights of bears and their chest sizes…
Q: Explain why is it important to use ANOVA instead of several t tests to evaluate differences between…
A: Using several t -test, increase the type I error. In anova type I error is less as compare to t-test…
Q: Arconic Inc is a producer of aluminum components for the avionics and automotive industries. At its…
A:
Q: Measures of central tendency alone are insufficient to completely describe a sample because:
A: Hint: Central value for two samples can be same.
Q: A researcher compares differences in positivity between participants in a low-, middle-, or…
A: A researcher compares differences in positivity between participants in a low-, middle-, or…
Q: Perform the analysis of variance (ANOVA) at the 5% significance level to identify is there any…
A: Excel Procedure: Enter the data for 1, 2, 3 in Excel sheet>Go to Data Menu>Click on Data…
Q: Suppose you receive the following ANOVA output in this study. What is the correct conclusion about…
A: From the given ANOVA output, the F statistic value is F(2,27) = 4.47 and the Sig. value (p-value) is…
Q: A large department store examined a sample of the 21 credit card sales and recorded the amounts…
A: Given information- A number of types of credit cards (or no. of treatments) k = 3 No. of credit card…
Q: Is there truly a significant difference between the two data sets?
A: Test is that whether there is truly significant difference between the two data sets. The test…
Q: The ecology club at a local high school took separate random samples of sophomores, juniors, and…
A: The club performed a chi-square test for homogeneity across the three grade levels. Let p1 is the…
Q: for a two way factor anova comparing the possible interaction between religion and anxiety, what is…
A: ANOVA helps to find out whether the differences between groups of data are statistically…
Q: ifty-four wild bears were anesthetized, and then their weights and chest sizes were measured and…
A: The correlation coefficient is 0.955 (rounded to 3 decimal places).
Q: One advantage of a within subjects ANOVA is that the participants serve as their own comparisons…
A: Here we want to know given statement is correct or not.
Q: The ecology club at a local high school took separate random samples of sophomores, juniors, and…
A: Given Information: The ecology club at a local high school took separate random samples of…

Step by step
Solved in 2 steps

- What is meant by the sample space of an experiment?The result of an One-Way ANOVA for total stress symptoms among four groups of teachers (pre-k, elementary, middle, high school) was F(3, 117) = 3.827, p < .05. The corresponding effect size was η2 = .26. What can be concluded about these results?A case-control (or retrospective) study was conducted to investigate a relationship between the colors of helmets worn by motorcycle drivers and whether they are injured or killed in a crash. Results are given in the accompanying table. Using a 0.05 significance level, test the claim that injuries are independent of helmet color.
- According to the U.S. Transportation Security Administration (TSA), 2% of the 771,556,886 travelers who utilized 440 federalized airports in 2017 waited more than 20 minutes in the TSA security line. The File TSAWaitTimes contains waiting Times in TSA security lines at a major U.S. airport for a recent random sample 10,531 travelers. Use these Data to test the hypothesis that the proportion of travelers waiting more than 20 minutes in TSA security lines at this airport is the same as the national proportion at α = .05 Data given: Time In Line Mean 11.99496 Median 11.97536 Standard Deviation 3.992043 Confidence Level(95.0%) 0.076253 Provide a 95% confidence interval with interpretationA grassroots group opposed to a proposed increase in the gas tax claimed that the increase would hurt working-class people the most, since they commute the farthest to work. Suppose that the group randomly surveyed 24 individuals and asked them their daily one-way commuting mileage. The results are in Table below. Using a 5% significance level, test the hypothesis that the three mean commuting mileages are the same. working-class professional (middle incomes) professional (wealthy) 17.8 16.5 8.5 26.7 17.4 6.3 49.4 22.0 4.6 9.4 7.4 12.6 65.4 9.4 11.0 47.1 2.1 28.6 19.5 6.4 15.4 51.2 13.9 9.3A computer manufacturer believes that the proportion of hardware malfunctions is different in humid climates than in dry climates. To test this claim, the manufacturer takes a random sample of 400 machines sold in Florida (humid) and 400 machines sold in Arizona (dry). The manufacturer finds that 44 of the machines in Florida and 24 of the machines in Arizona had hardware malfunctions. d. Does the evidence support the computer manufacturer's claim at the 10% significance level?
- Explain why is it important to use ANOVA instead of several t tests to evaluate differences between 2 or more groups.A researcher was interested in whether there were differences in the level of activity in children who had been diagnosed with ADHA depending on whether they had received no treatment, were on Ritalin, or were in a behavior management program. He recruited 90 children with ADHD to participate, and randomly assigned each child to one of the three groups. The number of classroom disturbances during a 1 hour period was measured for each child. Which statistical test would be best to determine if there is a significant difference between groups? one-sample t-test dependent samples t-test independent samples t-test ANOVAA researcher was interested in whether there were differences in the level of activity in children who had been diagnosed with ADHA depending on whether they had received no treatment, were on Ritalin, or were in a behavior management program. He recruited 90 children with ADHD to participate, and randomly assigned each child to one of the three groups. The number of classroom disturbances during a 1 hour period was measured for each child. Which statistical test would be best to determine if there is a significant difference between groups? one-sample t-test dependent samples t-test ANOVA
- Use an ANOVA with α = .05 to determine whether there are any significant differences among the three treatment means.What source of variation is found in an ANOVA summary table for a within subjects design that is not in an ANOVA summary table for a between subjects design. What happens to this source of variation in a between-subjects design?
