A taxi company claims that its drivers have an average of at least 12.4 years' experience. In a study of 15 taxi drivers, the average experience was 11.2 years. The standard deviation was 2. At a = 0.10, is the number of years' experience of the taxi drivers really less than the taxi company claimed. State the hypotheses and identify the claim. b. Identify the statistical test to be used. Find for the critical value(s). d. Sketch a curve with the rejection and non-rejection region. e. Computer for the test value. f. Make the decision. а. с. g. Interpret the results.
A taxi company claims that its drivers have an average of at least 12.4 years' experience. In a study of 15 taxi drivers, the average experience was 11.2 years. The standard deviation was 2. At a = 0.10, is the number of years' experience of the taxi drivers really less than the taxi company claimed. State the hypotheses and identify the claim. b. Identify the statistical test to be used. Find for the critical value(s). d. Sketch a curve with the rejection and non-rejection region. e. Computer for the test value. f. Make the decision. а. с. g. Interpret the results.

MATLAB: An Introduction with Applications
6th Edition
ISBN:9781119256830
Author:Amos Gilat
Publisher:Amos Gilat
Chapter1: Starting With Matlab
Section: Chapter Questions
Problem 1P

Related questions
Question
It would be an honor if all the questions will be answered. I will give a feedback in return. Thanks!
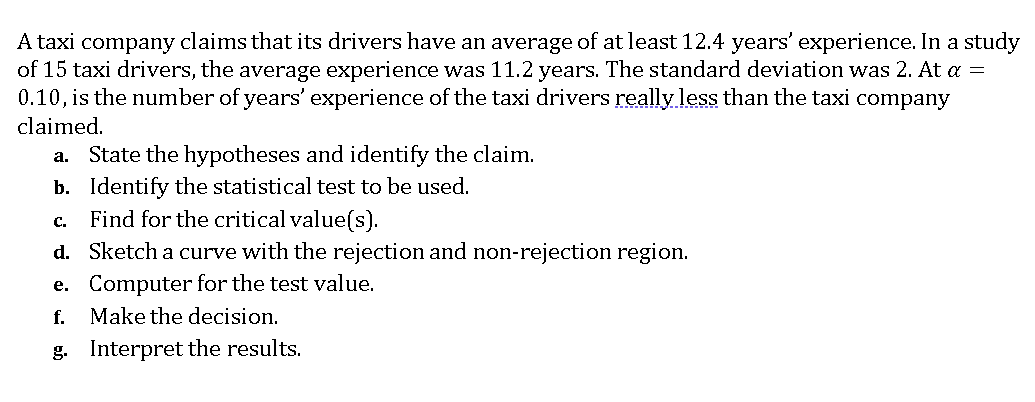
Transcribed Image Text:A taxi company claims that its drivers have an average of at least 12.4 years' experience. In a study
of 15 taxi drivers, the average experience was 11.2 years. The standard deviation was 2. At a =
0.10, is the number of years' experience of the taxi drivers really less than the taxi company
claimed.
State the hypotheses and identify the claim.
b. Identify the statistical test to be used.
Find for the critical value(s).
d. Sketch a curve with the rejection and non-rejection region.
e. Computer for the test value.
f. Make the decision.
а.
с.
g. Interpret the results.
Expert Solution
This question has been solved!
Explore an expertly crafted, step-by-step solution for a thorough understanding of key concepts.

This is a popular solution!

Trending now
This is a popular solution!

Step by step
Solved in 2 steps with 2 images

Recommended textbooks for you
MATLAB: An Introduction with Applications
Statistics
ISBN:
9781119256830
Author:
Amos Gilat
Publisher:
John Wiley & Sons Inc

Probability and Statistics for Engineering and th…
Statistics
ISBN:
9781305251809
Author:
Jay L. Devore
Publisher:
Cengage Learning

Statistics for The Behavioral Sciences (MindTap C…
Statistics
ISBN:
9781305504912
Author:
Frederick J Gravetter, Larry B. Wallnau
Publisher:
Cengage Learning
MATLAB: An Introduction with Applications
Statistics
ISBN:
9781119256830
Author:
Amos Gilat
Publisher:
John Wiley & Sons Inc
Probability and Statistics for Engineering and th…
Statistics
ISBN:
9781305251809
Author:
Jay L. Devore
Publisher:
Cengage Learning
Statistics for The Behavioral Sciences (MindTap C…
Statistics
ISBN:
9781305504912
Author:
Frederick J Gravetter, Larry B. Wallnau
Publisher:
Cengage Learning

Elementary Statistics: Picturing the World (7th E…
Statistics
ISBN:
9780134683416
Author:
Ron Larson, Betsy Farber
Publisher:
PEARSON

The Basic Practice of Statistics
Statistics
ISBN:
9781319042578
Author:
David S. Moore, William I. Notz, Michael A. Fligner
Publisher:
W. H. Freeman

Introduction to the Practice of Statistics
Statistics
ISBN:
9781319013387
Author:
David S. Moore, George P. McCabe, Bruce A. Craig
Publisher:
W. H. Freeman