A teacher finds that final grades in the statistics department are distributed as: A, 25%; B, 25%; C, 40%; D, 5%; F, 5%. At the end of a randomly selected semester, the following grades were recorded. Calculate the chi-square test statistic used to determine if the grade distribution for the department is different than expected. Use a = 0.01. Grade | A B Cc DF Number 42 36 60 8 14 B) 6.87 A) 4.82 C) 3.41 D) 5.25
A teacher finds that final grades in the statistics department are distributed as: A, 25%; B, 25%; C, 40%; D, 5%; F, 5%. At the end of a randomly selected semester, the following grades were recorded. Calculate the chi-square test statistic used to determine if the grade distribution for the department is different than expected. Use a = 0.01. Grade | A B Cc DF Number 42 36 60 8 14 B) 6.87 A) 4.82 C) 3.41 D) 5.25

Glencoe Algebra 1, Student Edition, 9780079039897, 0079039898, 2018
18th Edition
ISBN:9780079039897
Author:Carter
Publisher:Carter
Chapter10: Statistics
Section10.4: Distributions Of Data
Problem 19PFA

Related questions

Question
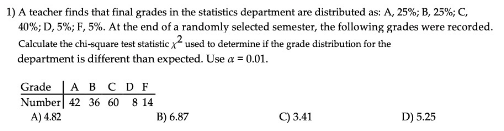
Transcribed Image Text:1) A teacher finds that final grades in the statistics department are distributed as: A, 25%; B, 25%; C,
40%; D, 5%; F, 5%. At the end of a randomly selected semester, the following grades were recorded.
Calculate the chi-square test statistic x used to determine if the grade distribution for the
department is different than expected. Use a = 0.01.
Grade | A B C D F
Number 42 36 60 8 14
B) 6.87
A) 4.82
C) 3.41
D) 5.25
Expert Solution
This question has been solved!
Explore an expertly crafted, step-by-step solution for a thorough understanding of key concepts.

This is a popular solution!

Trending now
This is a popular solution!

Step by step
Solved in 2 steps with 2 images

Knowledge Booster


Learn more about
Need a deep-dive on the concept behind this application? Look no further. Learn more about this topic, statistics and related others by exploring similar questions and additional content below.Recommended textbooks for you
Glencoe Algebra 1, Student Edition, 9780079039897…
Algebra
ISBN:
9780079039897
Author:
Carter
Publisher:
McGraw Hill
Glencoe Algebra 1, Student Edition, 9780079039897…
Algebra
ISBN:
9780079039897
Author:
Carter
Publisher:
McGraw Hill