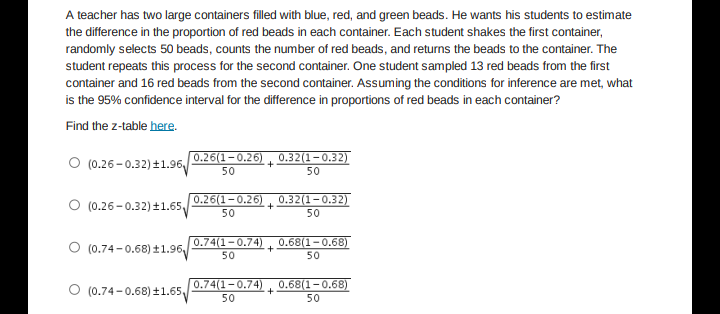
A teacher has two large containers filled with blue, red, and green beads. He wants his students to estimate the difference in the proportion of red beads in each container. Each student shakes the first container, randomly selects 50 beads, counts the number of red beads, and returns the beads to the container. The student repeats this process for the second container. One student sampled 13 red beads from the first container and 16 red beads from the second container. Assuming the conditions for inference are met, what is the 95% confidence interval for the difference in proportions of red beads in each container? Find the z-table here. O (0.26-0.32) ±1.96 0.26(1–0.26) , 0.32(1–0.32) 50 50 0.26(1-0.26) 0.32(1-0.32) O (0.26-0.32) ±1.65, 50 50 0.74(1-0.74) 50 0.68(1-0.68) O (0.74 -0.68) ±1.96, 50 0.74(1-0.74) 0.68(1-0.68) O (0.74-0.68) ±1.65. 50 50
A teacher has two large containers filled with blue, red, and green beads. He wants his students to estimate the difference in the proportion of red beads in each container. Each student shakes the first container, randomly selects 50 beads, counts the number of red beads, and returns the beads to the container. The student repeats this process for the second container. One student sampled 13 red beads from the first container and 16 red beads from the second container. Assuming the conditions for inference are met, what is the 95% confidence interval for the difference in proportions of red beads in each container? Find the z-table here. O (0.26-0.32) ±1.96 0.26(1–0.26) , 0.32(1–0.32) 50 50 0.26(1-0.26) 0.32(1-0.32) O (0.26-0.32) ±1.65, 50 50 0.74(1-0.74) 50 0.68(1-0.68) O (0.74 -0.68) ±1.96, 50 0.74(1-0.74) 0.68(1-0.68) O (0.74-0.68) ±1.65. 50 50

Glencoe Algebra 1, Student Edition, 9780079039897, 0079039898, 2018
18th Edition
ISBN:9780079039897
Author:Carter
Publisher:Carter
Chapter10: Statistics
Section10.6: Summarizing Categorical Data
Problem 10CYU

Related questions
Question
Transcribed Image Text:A teacher has two large containers filled with blue, red, and green beads. He wants his students to estimate
the difference in the proportion of red beads in each container. Each student shakes the first container,
randomly selects 50 beads, counts the number of red beads, and returns the beads to the container. The
student repeats this process for the second container. One student sampled 13 red beads from the first
container and 16 red beads from the second container. Assuming the conditions for inference are met, what
is the 95% confidence interval for the difference in proportions of red beads in each container?
Find the z-table here.
0.26(1-0.26) , 0.32(1-0.32)
O (0.26-0.32) +1.96
+
50
50
O (0.26-0.32) ±1.65
0.26(1-0.26)
0.32(1-0.32)
+
50
50
O (0.74-0.68) ±1.96,
0.74(1-0.74)
0.68(1-0.68)
50
50
O (0.74-0.68) ±1.65
0.74(1-0.74)
0.68(1-0.68)
50
50
Expert Solution
This question has been solved!
Explore an expertly crafted, step-by-step solution for a thorough understanding of key concepts.

This is a popular solution!

Trending now
This is a popular solution!

Step by step
Solved in 3 steps with 3 images

Recommended textbooks for you
Glencoe Algebra 1, Student Edition, 9780079039897…
Algebra
ISBN:
9780079039897
Author:
Carter
Publisher:
McGraw Hill

Holt Mcdougal Larson Pre-algebra: Student Edition…
Algebra
ISBN:
9780547587776
Author:
HOLT MCDOUGAL
Publisher:
HOLT MCDOUGAL

Algebra & Trigonometry with Analytic Geometry
Algebra
ISBN:
9781133382119
Author:
Swokowski
Publisher:
Cengage
Glencoe Algebra 1, Student Edition, 9780079039897…
Algebra
ISBN:
9780079039897
Author:
Carter
Publisher:
McGraw Hill
Holt Mcdougal Larson Pre-algebra: Student Edition…
Algebra
ISBN:
9780547587776
Author:
HOLT MCDOUGAL
Publisher:
HOLT MCDOUGAL
Algebra & Trigonometry with Analytic Geometry
Algebra
ISBN:
9781133382119
Author:
Swokowski
Publisher:
Cengage

College Algebra (MindTap Course List)
Algebra
ISBN:
9781305652231
Author:
R. David Gustafson, Jeff Hughes
Publisher:
Cengage Learning