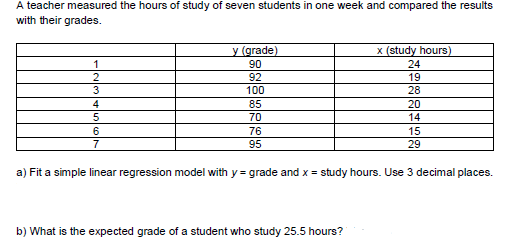
with their grades. y (grade) 90 92 100 x (study hours) 24 19 28 1 85 70 20 14 76 95 15 29 7 a) Fit a simple linear regression model with y = grade and x = study hours. Use 3 decimal places. b) What is the expected grade of a student who study 25.5 hours?


Q: The following table shows the annual number of PhD graduates in a country in various fields.…
A: (a)Step-by-step procedure to obtain the regression equation using Excel:In Excel sheet, enter X in…
Q: Even if the error terms in the regression equation, H1,H_2,....,µ_n, are not normally distributed,…
A: “Since you have asked multiple questions, we will solve the first question for you. If you want any…
Q: The following table gives information on the amount of sugar (in grams) and the calorie count in one…
A: Given that, the predictive regression equation is y^=91.636+4.730x where, y is calories and x is…
Q: 5. а) The data showing the time required for a merchandiser to stock a grocery store shelf with a…
A: Data represents the time required for a merchandiser to stock a grocery store shelf with a soft…
Q: The following table gives information on the amount of sugar (in grams) and the calorie count in one…
A: Given regression equation is y=79.555+5.631x If x=15 then y=?
Q: The table below shows the average temperature in New York City (NYC), measured in degrees Fahrenheit…
A:
Q: A teacher measured the hours of study of seven students in one week and compared the re with their…
A: Consider, x y x^2 y^2 xy 24 90 576 8100 2160 19 92 361 8464 1748 28 100 784 10000 2800…
Q: Fit a nonlinear regression equation of the form y = aX® to the following data: 5 1 2 3 4 2.98 4.26…
A: The power regression technique uses a dataset to determine a function, y=axb such that the data set…
Q: The average gasoline price per gallon (in cities) and the cost of a barrel of oil are shown for a…
A: a) In this case, cost of oil is the independent variable (x), and cost of gasoline is the dependent…
Q: The following table shows the annual number of PhD graduates in a country in various fields.…
A: Excel output:
Q: 1. The table below is about the academic performance in Mathematics of 10 students. Make a simple…
A:
Q: The table below shows the average temperature in New York City (NYC), measured in degrees Fahrenheit…
A: Concept: We have given the temperature with respect to the months That is for each month the degree…
Q: 2) The accompanying table shows the percent of the adult population that married before age 25 in…
A: Given: From the above table X is years and Y is percent. Sum of X…
Q: Assume that there is a positive linear correlation between the variable R (return rate in percent of…
A: Correlation Coefficient: It is one of the statistical measures. It is used between any…
Q: Consider the table below, containing data on six individuals' education and employment status.…
A: Given Solution:
Q: The following table shows the average life expectancy, in years, of a child born in the given year.†…
A: Step-by-step procedure to obtain the regression equation using MINITAB:Choose Stat > Regression…
Q: The table below is a record of the number of miles driven between stops for gas and the amount of…
A: Regression analysis is the measure of the average relationship between two or more variables in…
Q: Use Linear Regression to fit the following experimental data X 0 3 2 3 1 6 Y 5 1 2 10 9 8 5 10
A: We need to find linear equation. As per Bartleby's guidelines we can only solve one question. Please…
Q: 00 00 30 40 50 60 samp_reg$Age 00 8 20 30 40 50 60 samp_reg$Age resid(test) samp_reg$In_Income -0.5…
A: The conditions for the validity of a regression analysis are that the the error are normally…
Q: According to the summary result of linear regression model between A and B obtained from R given…
A: Simple linear Regression equation: It deals with one dependent variable and one independent…
Q: 7) The following chart shows the distance from New City and the median housing prices in those…
A: Given: Distance from New City (x) Median home price (y) 12 390 15 400 28 310 20 290 5…
Q: (a) Fit a multiple linear regression model to the data. (b) Predict HFE (y) when x1 = 14.5, x2 =…
A: 2. (a) The regression analysis is conducted using EXCEL. The software procedure is given below:…
Q: The sales, in millions of pesos, of a certain company are shown in the table below. Year X Sales Y 1…
A: Given data is Year X 1 2 3 4 5 6 7 8 9 10 Sales Y 12 15 17 18 16 19 21 20 22 24
Q: For a simple linear regression model, a 100(1 - a)% prediction interval for a new value of Y when X…
A: PI consists range of values that is likely to contain the value of a single new observation given…
Q: The following table shows the age (X) and blood pressure (Y) of 8 persons : X: 52 63 45 36 72 65 47…
A:
Q: 1.) The table below is about the academic performance in Mathematics of 10 students. Make a simple…
A: The regression analysis is conducted here by using EXCEL. The software procedure is given below:…
Q: A sales manager has collected the following data on annual sales (y) and years of experience (x) .…
A:
Q: A teacher measured the hours of study of seven students in one week and compared the results with…
A: a. Regression: The regression analysis is conducted using EXCEL. The software procedure is given…
Q: after Decrease in Utilization of Hormone Replacement Therapy." The authors of the paper used a…
A:
Q: the following table lists democrats spending thousands of dollars by statewide office and the…
A: Use the given data to form excel table: X Y X*Y X*X Y*Y 11.5 33.4 384.1 132.25 1115.56…
Q: (a) Calculate A, B, C, D and E. (b) At a = 0.05 test whether the regression model are fit.
A: The Analysis of variance for the simple linear regression table is given.
Q: The following table shows the annual number of PhD graduates in a country in various fields. Natural…
A:
Q: A real estate agency collects data concerning the sales of a house (in thousands of dollars) and…
A: Equation of regression line is:
Q: Assume that there is a positive linear correlation between the variable R (return rate in percent of…
A: There are two variable, age in years of investment (t) independent variable. Return in percent of…
Q: An experiment is run. The mass of an object is recorded over time. Time (min) Mass (g) 11 35 12 11…
A: Given data, X Y X*Y X*X 11 35 385 121 12 11 132 144 13 7 91 169 16 7 112 256 41 7 287…
Q: 1. The accompanying table shows the number of movie theaters showing a popular film and the film's…
A:
Q: The following data give the percentage of women working in five companies in the retail and trade…
A: For the given data a. Develop the estimated regression equation by computing the values b0 and b1 b.…
Q: Q5/ A: Use Linear Regression to fit the following experimental data X 0 3 2 3 1 6 Y 5 1 2 10 9 8 5…
A: Note: Hi and thanks for your question! Unfortunately, as per our guideline, only one question should…
Q: A professor in the School of Business in a university polled a dozen colleagues about the number of…
A:
Q: The following table lists democrats spending thousands of dollars by statewide office and the…
A: the regression equation y = ax+ b y=-02135(x)+48.7695 if he spent 60000 on campaign x= 60 y =…
Q: 17. The data below show the average ages and lengths of service in months for five randomly chosen…
A: 17) Given data, Age,x Time,y 24.9 66.5 25.6 70 26.1 74.8 27.3 89.6 27 82.6
Q: The following table shows the number of cars sold last month by six dealers at Centreville Nissan…
A: The data shows the number of years of sales experience, and monthly car sales.
Q: The following table gives information on the amount of sugar (in grams) and the calorie count in one…
A: Given Regression equation is y=97.555+4.730x If x=54 y=?
Q: The following table shows the annual number of PhD graduates in a country in various fields.…
A: Given : Data represents the annual number of PhD graduates in a country in various fields. In…
Q: The table below shows enrollment,† in millions of people, in private colleges in the United States…
A:
Q: The following estimated regression model was developed relating yearly income (y in $1000s) of 30…
A: From the provided information, Age = (x1) And their gender = (x2) (0 if male and 1 if female). As,…
Q: B- A data of 8 employees on ownership of company as: Firm-X 6 12 14 6 9 13 15 9 Versus Y 300 408 560…
A: The objective is to find the regression value for the following data: x y 6 300 12 408 14…
Q: 8. The sales manager of a large apartment rental complex feels the demand for apartments may be…
A:
Q: The following data give the percentage of women working in five companies in the retail and trade…
A: Linear regression equation is a equation that is used to predict the relation between two variables…
Q: 1. The following is an image of a Cartesian diagram. y (3, 4) (5, 4) (3, 3) (6, 3) (3, 2) 2. (1, 1)…
A: Given information: The cartesian diagram is given.


Trending now
This is a popular solution!

Step by step
Solved in 2 steps

- Find the equation of the regression line for the following data set. x 1 2 3 y 0 3 4Olympic Pole Vault The graph in Figure 7 indicates that in recent years the winning Olympic men’s pole vault height has fallen below the value predicted by the regression line in Example 2. This might have occurred because when the pole vault was a new event there was much room for improvement in vaulters’ performances, whereas now even the best training can produce only incremental advances. Let’s see whether concentrating on more recent results gives a better predictor of future records. (a) Use the data in Table 2 (page 176) to complete the table of winning pole vault heights shown in the margin. (Note that we are using x=0 to correspond to the year 1972, where this restricted data set begins.) (b) Find the regression line for the data in part ‚(a). (c) Plot the data and the regression line on the same axes. Does the regression line seem to provide a good model for the data? (d) What does the regression line predict as the winning pole vault height for the 2012 Olympics? Compare this predicted value to the actual 2012 winning height of 5.97 m, as described on page 177. Has this new regression line provided a better prediction than the line in Example 2?For the following exercises, use Table 4 which shows the percent of unemployed persons 25 years or older who are college graduates in a particular city, by year. Based on the set of data given in Table 5, calculate the regression line using a calculator or other technology tool, and determine the correlation coefficient. Round to three decimal places of accuracy
- The following fictitious table shows kryptonite price, in dollar per gram, t years after 2006. t= Years since 2006 0 1 2 3 4 5 6 7 8 9 10 K= Price 56 51 50 55 58 52 45 43 44 48 51 Make a quartic model of these data. Round the regression parameters to two decimal places.The following table displays the mathematics test scores for a random sample of college students, along with their final SY16C grades. a. Fit the regression line y = a+bx to the data and interpret the results. b. Use the regression equation to determine the SY16C grade for a college student who scored60 on their achievement test. What would their SY16C grade be?The number of initial public offerings of stock issued in a 10-year period and the total proceeds of these offerings (in millions) are shown in the table. The equation of the regression line is y=47.271x+18,712.47. Issues, x Proceeds, y425 18,758468 29,602678 43,797478 31,661485 65,518396 65,33069 21,42764 11,847181 32,392157 27,561 Complete parts a and b. The number of initial public offerings of stock issued in a 10-year period and the total proceeds of these offerings (in millions) are shown in the table. The equation of the regression line is y=47.271x+18,712.47. Complete parts a and b. (a) Find the coefficient of determination and interpret the result. (Round to three decimal places as needed.) (b) Find the standard error of estimate se and interpret the result. (Round to three decimal places as needed.)
- (a) The standard error Se of the linear regression model is given in the printout as "S." What is the value of Se?The marketing manager of a supermarket chain would like to determine the effect of shelf spaceon the sales of pet food. A random sample of 10 stores was selected, and the results are presentedbelow. Store shelf space in cm weekly sales in thousand pesos 1 45 18 2 45 21 3 75 15 4 80 18 5 95 23 6 100 26 7 135 22 8 140 27 9 185 25 10 190 28 d. Using the estimated simple linear regression equation Y=15.6414+0.0611X, estimate the weekly sales when theshelf space is 230cm? 250cm? e. Compute the coefficient of determination and interpret its value.A research department of an American automobile company wants to develop a model to predict gasoline mileage (measured in MPG) of the company’s vehicles by using their horsepower and weights (measured in pounds). To do this, it took a random sample of 50 vehicles to perform a regression analysis as follows: Regression Statistics Multiple R 0.865689 R Square 0.749417 Adjusted R Square 0.738754 Standard Error 4.176602 Observations 50 ANOVA df SS MS F Regression a 2451.973702 1225.987 d Residual b 819.8680976 c Total 49 3271.8418 Coefficients Standard Error t Stat Intercept 58.15708 2.658248208 21.87797 Horsepower -0.11753 0.032643428 -3.60028 Weight -0.00687 0.001401173 -4.90349 (a) State the multiple regression equation. Interpret the meanings of the coefficients for horsepower and weight. (b) Test the validity of this multiple regression equation at the significance level of 1%. Show your reasoning. (c) The research department claims that the weight of…
- An article reported that for a regression of y = average SAT score on x = expenditure per pupil, based on data from n = 44 New Jersey school districts, a = 766, b = 0.015, r2 = 0.160, and se = 53.7. One observation in the sample was (9400, 897). What average SAT score would you predict for this district, and what is the corresponding residual?Predict average SAT score _______ Residual ________The owner of Showtime Movie Theaters, Inc., would like to predict weekly gross revenueas a function of advertising expenditures. Historical data for a sample of eight weeks follow. Weekly GrossRevenue($1000s) Television Advertising($1000s) Newspaper Advertising($1000s) 96 5.0 1.5 90 2.0 2.0 95 4.0 1.5 92 2.5 2.5 95 3.0 3.3 94 3.5 2.3 94 2.5 4.2 94 3.0 2.5 a. Develop an estimated regression equation with the amount of televisionadvertising as the independent variable.b. Develop an estimated regression equation with both television advertising and newspaper advertising as the independent variables. c. Is the estimated regression equation coefficient for television advertisingexpenditures the same in part (a) and in part (b)? Interpret the coefficient in each case. d. Predict weekly gross revenue for a week when $3500 is spent on television advertising and $1800 is spent on newspaper advertising.The prelim grades (x) and midterm grades (y) of a sample of 10 MMW students is modeled by the regression line y = 12.0623 + 0.7771x. Estimate the prelim grade if the midterm grade is 83.


