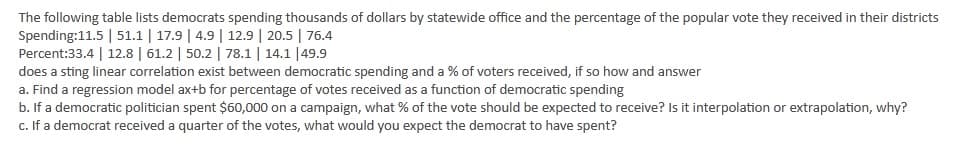
The following table lists democrats spending thousands of dollars by statewide office and the percentage of the popular vote they received in their districts Spending:11.5 | 51.1 | 17.9 | 4.9| 12.9 | 20.5 | 76.4 Percent:33.4| 12.8 | 61.2 | 50.2 | 78.1 | 14.1 |49.9 does a sting linear correlation exist between democratic spending and a % of voters received, if so how and answer a. Find a regression model ax+b for percentage of votes received as a function of democratic spending b. If a democratic politician spent $60,000 on a campaign, what % of the vote should be expected to receive? Is it interpolation or extrapolation, why? c. If a democrat received a quarter of the votes, what would you expect the democrat to have spent?


Correlation
Correlation defines a relationship between two independent variables. It tells the degree to which variables move in relation to each other. When two sets of data are related to each other, there is a correlation between them.
Linear Correlation
A correlation is used to determine the relationships between numerical and categorical variables. In other words, it is an indicator of how things are connected to one another. The correlation analysis is the study of how variables are related.
Regression Analysis
Regression analysis is a statistical method in which it estimates the relationship between a dependent variable and one or more independent variable. In simple terms dependent variable is called as outcome variable and independent variable is called as predictors. Regression analysis is one of the methods to find the trends in data. The independent variable used in Regression analysis is named Predictor variable. It offers data of an associated dependent variable regarding a particular outcome.


Trending now
This is a popular solution!

Step by step
Solved in 2 steps


