A telephone counseling service for adolescents tested whether the length of calls would be affected by a special telephone system that had a better sound quality. Over the past several years, the lengths of telephone calls (in minutes) were normally distributed with μ=14 and σ=8. The service arranged to have the special phone system loaned to them for one day. On that day, the mean length of the 44 calls they received was 15 minutes. Test whether the length of calls has changed using the 5% significance level.
A telephone counseling service for adolescents tested whether the length of calls would be affected by a special telephone system that had a better sound quality. Over the past several years, the lengths of telephone calls (in minutes) were normally distributed with μ=14 and σ=8. The service arranged to have the special phone system loaned to them for one day. On that day, the mean length of the 44 calls they received was 15 minutes. Test whether the length of calls has changed using the 5% significance level.

MATLAB: An Introduction with Applications
6th Edition
ISBN:9781119256830
Author:Amos Gilat
Publisher:Amos Gilat
Chapter1: Starting With Matlab
Section: Chapter Questions
Problem 1P

Related questions

Question
A telephone counseling service for adolescents tested whether the length of calls would be affected by a special telephone system that had a better sound quality. Over the past several years, the lengths of telephone calls (in minutes) were
μ=14
and
σ=8.
The service arranged to have the special phone system loaned to them for one day. On that day, the mean length of the
44
calls they received was
15
minutes. Test whether the length of calls has changed using the 5% significance level.
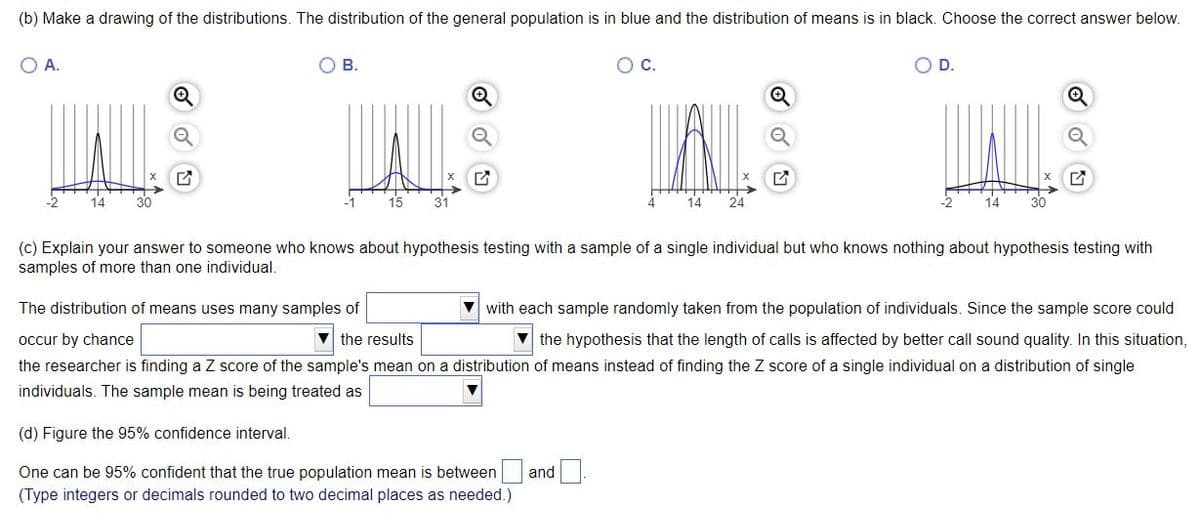
Transcribed Image Text:(b) Make a drawing of the distributions. The distribution of the general population is in blue and the distribution of means is in black. Choose the correct answer below.
A.
O B.
OC.
D.
14
15
31
14
24
(c) Explain your answer to someone who knows about hypothesis testing with a sample of a single individual but who knows nothing about hypothesis testing with
samples of more than one individual,
The distribution of means uses many samples of
V with each sample randomly taken from the population of individuals. Since the sample score could
V the hypothesis that the length of calls is affected by better call sound quality. In this situation,
the researcher is finding a Z score of the sample's mean on a distribution of means instead of finding the Z score of a single individual on a distribution of single
occur by chance
V the results
individuals. The sample mean is being treated as
(d) Figure the 95% confidence interval.
One can be 95% confident that the true population mean is between
and
(Type integers or decimals rounded to two decimal places as needed.)
Expert Solution
This question has been solved!
Explore an expertly crafted, step-by-step solution for a thorough understanding of key concepts.

This is a popular solution!

Trending now
This is a popular solution!

Step by step
Solved in 4 steps with 9 images

Knowledge Booster


Learn more about
Need a deep-dive on the concept behind this application? Look no further. Learn more about this topic, statistics and related others by exploring similar questions and additional content below.Recommended textbooks for you
MATLAB: An Introduction with Applications
Statistics
ISBN:
9781119256830
Author:
Amos Gilat
Publisher:
John Wiley & Sons Inc

Probability and Statistics for Engineering and th…
Statistics
ISBN:
9781305251809
Author:
Jay L. Devore
Publisher:
Cengage Learning

Statistics for The Behavioral Sciences (MindTap C…
Statistics
ISBN:
9781305504912
Author:
Frederick J Gravetter, Larry B. Wallnau
Publisher:
Cengage Learning
MATLAB: An Introduction with Applications
Statistics
ISBN:
9781119256830
Author:
Amos Gilat
Publisher:
John Wiley & Sons Inc
Probability and Statistics for Engineering and th…
Statistics
ISBN:
9781305251809
Author:
Jay L. Devore
Publisher:
Cengage Learning
Statistics for The Behavioral Sciences (MindTap C…
Statistics
ISBN:
9781305504912
Author:
Frederick J Gravetter, Larry B. Wallnau
Publisher:
Cengage Learning

Elementary Statistics: Picturing the World (7th E…
Statistics
ISBN:
9780134683416
Author:
Ron Larson, Betsy Farber
Publisher:
PEARSON

The Basic Practice of Statistics
Statistics
ISBN:
9781319042578
Author:
David S. Moore, William I. Notz, Michael A. Fligner
Publisher:
W. H. Freeman

Introduction to the Practice of Statistics
Statistics
ISBN:
9781319013387
Author:
David S. Moore, George P. McCabe, Bruce A. Craig
Publisher:
W. H. Freeman