A telephone poll of 1000 adult Americans was reported in a magazine. One of the questions asked was "What is the main problem facing the country?" Suppose 22% answered "crime". We are interested in the population proportion of adult Americans who feel that crime is the main problem.
A telephone poll of 1000 adult Americans was reported in a magazine. One of the questions asked was "What is the main problem facing the country?" Suppose 22% answered "crime". We are interested in the population proportion of adult Americans who feel that crime is the main problem.

MATLAB: An Introduction with Applications
6th Edition
ISBN:9781119256830
Author:Amos Gilat
Publisher:Amos Gilat
Chapter1: Starting With Matlab
Section: Chapter Questions
Problem 1P

Related questions

Topic Video
Question
A telephone poll of 1000 adult Americans was reported in a magazine. One of the questions asked was "What is the main problem facing the country?" Suppose 22% answered "crime". We are interested in the population proportion of adult Americans who feel that crime is the main problem.
NOTE: If you are using a Student's t-distribution, you may assume that the underlying population is
Please label each part
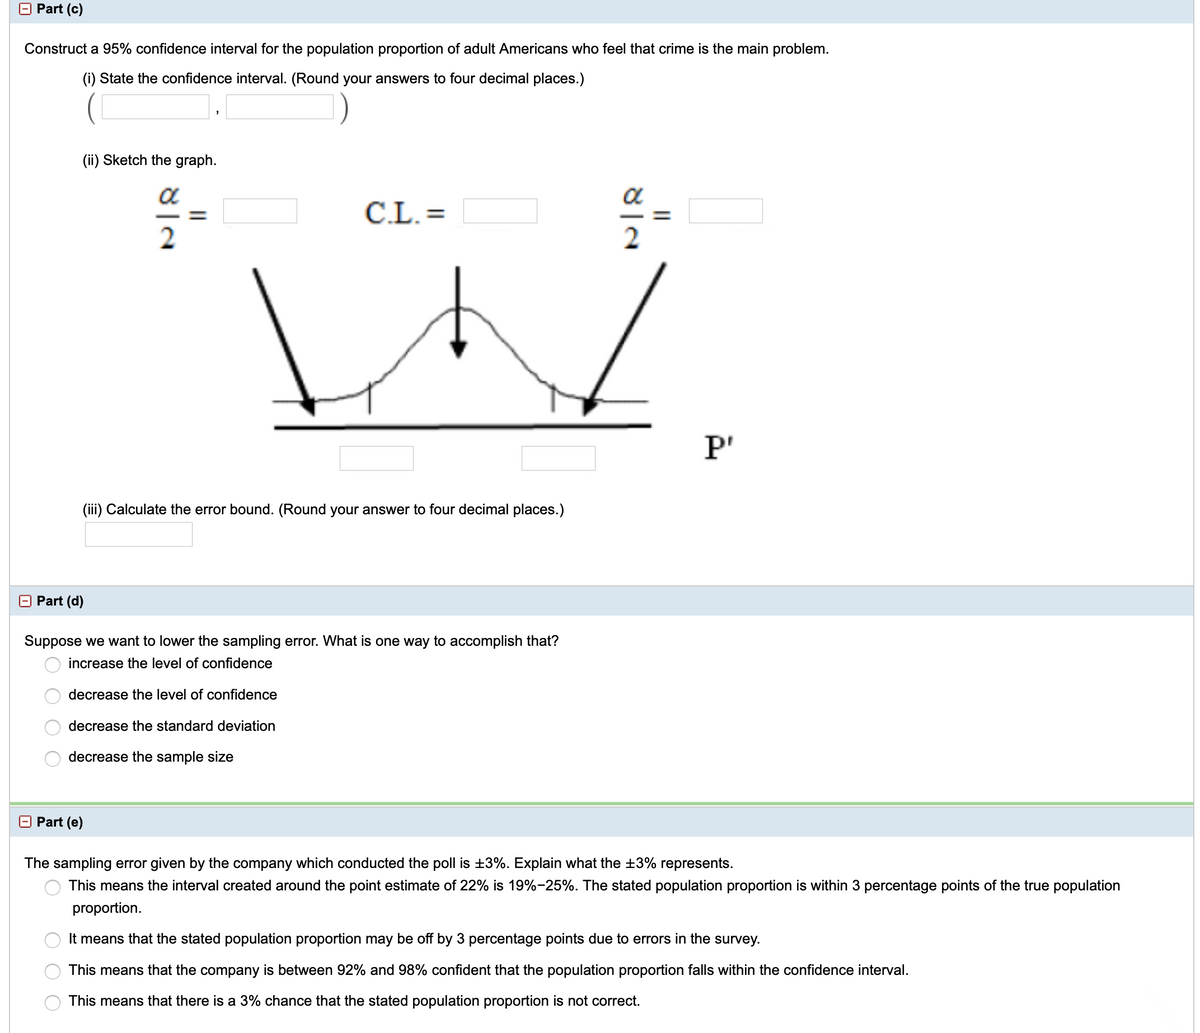
Transcribed Image Text:Part (c)
Construct a 95% confidence interval for the population proportion of adult Americans who feel that crime is the main problem.
(i) State the confidence interval. (Round your answers to four decimal places.)
(ii) Sketch the graph.
a
C.L. =
-
P'
(iii) Calculate the error bound. (Round your answer to four decimal places.)
O Part (d)
Suppose we want to lower the sampling error. What is one way to accomplish that?
O increase the level of confidence
decrease the level of confidence
decrease the standard deviation
decrease the sample size
O Part (e)
The sampling error given by the company which conducted the poll is ±3%. Explain what the +3% represents.
O This means the interval created around the point estimate of 22% is 19%-25%. The stated population proportion is within 3 percentage points of the true population
proportion.
It means that the stated population proportion may be off by 3 percentage points due to errors in the survey.
This means that the company is between 92% and 98% confident that the population proportion falls within the confidence interval.
This means that there is a 3% chance that the stated population proportion is not correct.
Expert Solution
This question has been solved!
Explore an expertly crafted, step-by-step solution for a thorough understanding of key concepts.

This is a popular solution!

Trending now
This is a popular solution!

Step by step
Solved in 3 steps with 20 images

Knowledge Booster


Learn more about
Need a deep-dive on the concept behind this application? Look no further. Learn more about this topic, statistics and related others by exploring similar questions and additional content below.Recommended textbooks for you
MATLAB: An Introduction with Applications
Statistics
ISBN:
9781119256830
Author:
Amos Gilat
Publisher:
John Wiley & Sons Inc

Probability and Statistics for Engineering and th…
Statistics
ISBN:
9781305251809
Author:
Jay L. Devore
Publisher:
Cengage Learning

Statistics for The Behavioral Sciences (MindTap C…
Statistics
ISBN:
9781305504912
Author:
Frederick J Gravetter, Larry B. Wallnau
Publisher:
Cengage Learning
MATLAB: An Introduction with Applications
Statistics
ISBN:
9781119256830
Author:
Amos Gilat
Publisher:
John Wiley & Sons Inc
Probability and Statistics for Engineering and th…
Statistics
ISBN:
9781305251809
Author:
Jay L. Devore
Publisher:
Cengage Learning
Statistics for The Behavioral Sciences (MindTap C…
Statistics
ISBN:
9781305504912
Author:
Frederick J Gravetter, Larry B. Wallnau
Publisher:
Cengage Learning

Elementary Statistics: Picturing the World (7th E…
Statistics
ISBN:
9780134683416
Author:
Ron Larson, Betsy Farber
Publisher:
PEARSON

The Basic Practice of Statistics
Statistics
ISBN:
9781319042578
Author:
David S. Moore, William I. Notz, Michael A. Fligner
Publisher:
W. H. Freeman

Introduction to the Practice of Statistics
Statistics
ISBN:
9781319013387
Author:
David S. Moore, George P. McCabe, Bruce A. Craig
Publisher:
W. H. Freeman