a) The figure that follows is an idealized enlargement of the region near the cinnamaldehyde peak. Determine the retention time for cinnamaldehyde. (b) From the figure in part (a), determine the number of theoretical plates for the column.
a) The figure that follows is an idealized enlargement of the region near the cinnamaldehyde peak. Determine the retention time for cinnamaldehyde. (b) From the figure in part (a), determine the number of theoretical plates for the column.

Chapter32: Gas Chromatography
Section: Chapter Questions
Problem 32.23QAP

Related questions
Question
(a) The figure that follows is an idealized enlargement of the region near the cinnamaldehyde peak. Determine the retention time for cinnamaldehyde.
(b) From the figure in part (a), determine the number of theoretical plates for the column.
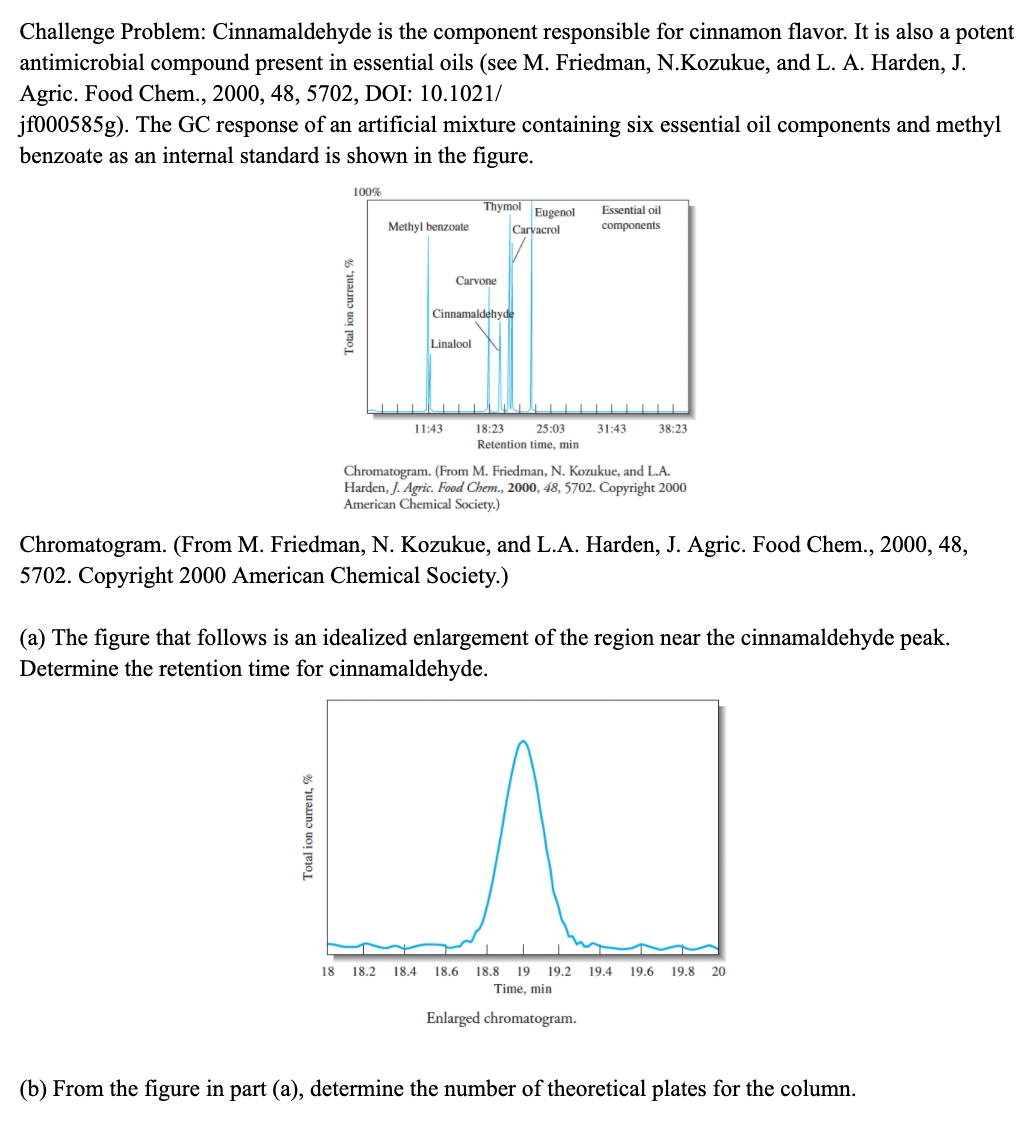
Transcribed Image Text:Challenge Problem: Cinnamaldehyde is the component responsible for cinnamon flavor. It is also a potent
antimicrobial compound present in essential oils (see M. Friedman, N.Kozukue, and L. A. Harden, J.
Agric. Food Chem., 2000, 48, 5702, DOI: 10.1021/
jf000585g). The GC response of an artificial mixture containing six essential oil components and methyl
benzoate as an internal standard is shown in the figure.
100%
Thymol
Eugenol
Essential oil
Methyl benzoate
Carvacrol
components
Carvone
Cinnamaldehyde
Linalool
11:43
18:23
25:03
31:43
38:23
Retention time, min
Chromatogram. (From M. Friedman, N. Kozukue, and L.A.
Harden, J. Agric. Food Chem., 2000, 48, 5702. Copyright 2000
American Chemical Society.)
Chromatogram. (From M. Friedman, N. Kozukue, and L.A. Harden, J. Agric. Food Chem., 2000, 48,
5702. Copyright 2000 American Chemical Society.)
(a) The figure that follows is an idealized enlargement of the region near the cinnamaldehyde peak.
Determine the retention time for cinnamaldehyde.
18 18.2 18.4
18.6
18.8
19 19.2
19.4 19.6
19.8
20
Time, min
Enlarged chromatogram.
(b) From the figure in part (a), determine the number of theoretical plates for the column.
Total ion current, %
Total ion current, %
Expert Solution
This question has been solved!
Explore an expertly crafted, step-by-step solution for a thorough understanding of key concepts.

This is a popular solution!

Trending now
This is a popular solution!

Step by step
Solved in 2 steps with 2 images

Knowledge Booster


Learn more about
Need a deep-dive on the concept behind this application? Look no further. Learn more about this topic, chemistry and related others by exploring similar questions and additional content below.Recommended textbooks for you

Principles of Instrumental Analysis
Chemistry
ISBN:
9781305577213
Author:
Douglas A. Skoog, F. James Holler, Stanley R. Crouch
Publisher:
Cengage Learning
Principles of Instrumental Analysis
Chemistry
ISBN:
9781305577213
Author:
Douglas A. Skoog, F. James Holler, Stanley R. Crouch
Publisher:
Cengage Learning