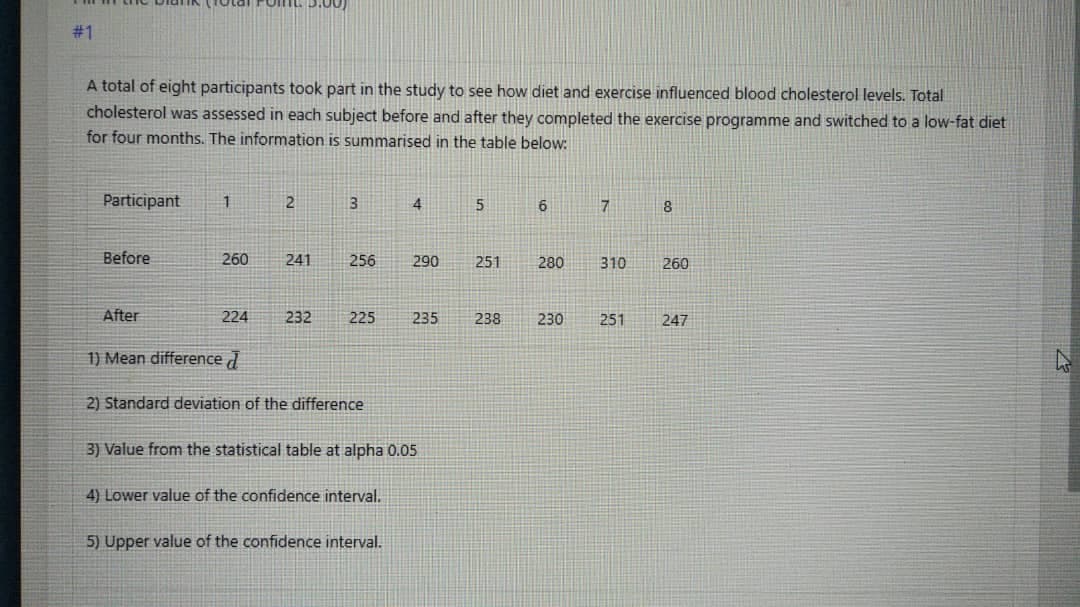
A total of eight participants took part in the study to see how diet and exercise influenced blood cholesterol levels. Total cholesterol was assessed in each subject before and after they completed the exercise programme and switched to a low-fat diet for four months. The information is summarised in the table below: Participant 13 8 Before 260 241 256 290 251 280 310 260 After 224 232 225 235 238 230 251 247 1) Mean difference d 2) Standard deviation of the difference 3) Value from the statistical table at alpha 0.05 4) Lower value of the confidence interval. 5) Upper value of the confidence interval.
A total of eight participants took part in the study to see how diet and exercise influenced blood cholesterol levels. Total cholesterol was assessed in each subject before and after they completed the exercise programme and switched to a low-fat diet for four months. The information is summarised in the table below: Participant 13 8 Before 260 241 256 290 251 280 310 260 After 224 232 225 235 238 230 251 247 1) Mean difference d 2) Standard deviation of the difference 3) Value from the statistical table at alpha 0.05 4) Lower value of the confidence interval. 5) Upper value of the confidence interval.

Functions and Change: A Modeling Approach to College Algebra (MindTap Course List)
6th Edition
ISBN:9781337111348
Author:Bruce Crauder, Benny Evans, Alan Noell
Publisher:Bruce Crauder, Benny Evans, Alan Noell
Chapter5: A Survey Of Other Common Functions
Section5.3: Modeling Data With Power Functions
Problem 6E: Urban Travel Times Population of cities and driving times are related, as shown in the accompanying...

Related questions
Question
Transcribed Image Text:#1
A total of eight participants took part in the study to see how diet and exercise influenced blood cholesterol levels. Total
cholesterol was assessed in each subject before and after they completed the exercise programme and switched to a low-fat diet
for four months. The information is summarised in the table below:
Participant
4
6
7
8
Before
260
241
256
290
251
280
310
260
After
224
232
225
235
238
230
251
247
1) Mean difference d
2) Standard deviation of the difference
3) Value from the statistical table at alpha 0.05
4) Lower value of the confidence interval.
5) Upper value of the confidence interval.
Expert Solution
This question has been solved!
Explore an expertly crafted, step-by-step solution for a thorough understanding of key concepts.

Step by step
Solved in 3 steps with 3 images

Recommended textbooks for you
Functions and Change: A Modeling Approach to Coll…
Algebra
ISBN:
9781337111348
Author:
Bruce Crauder, Benny Evans, Alan Noell
Publisher:
Cengage Learning

Linear Algebra: A Modern Introduction
Algebra
ISBN:
9781285463247
Author:
David Poole
Publisher:
Cengage Learning

Glencoe Algebra 1, Student Edition, 9780079039897…
Algebra
ISBN:
9780079039897
Author:
Carter
Publisher:
McGraw Hill
Functions and Change: A Modeling Approach to Coll…
Algebra
ISBN:
9781337111348
Author:
Bruce Crauder, Benny Evans, Alan Noell
Publisher:
Cengage Learning
Linear Algebra: A Modern Introduction
Algebra
ISBN:
9781285463247
Author:
David Poole
Publisher:
Cengage Learning
Glencoe Algebra 1, Student Edition, 9780079039897…
Algebra
ISBN:
9780079039897
Author:
Carter
Publisher:
McGraw Hill