a) Using a 3-year moving average, the forecasted registrations (in thousands) for years 4 through 12 are (round your responses to decimal place): Year Forecast 4 Year Forecast 5 4 6 5 7 6 8 b) Using a 3-year weighted moving average in which the registrations in the most recent year are given a weight of 2, and registratio other 2 years are each given a weight of 1, the forecasted registrations (in thousands) for years 4 through 12 are (round your respon one decimal place): 7 9 8 10 9 11 10 12 11 12
a) Using a 3-year moving average, the forecasted registrations (in thousands) for years 4 through 12 are (round your responses to decimal place): Year Forecast 4 Year Forecast 5 4 6 5 7 6 8 b) Using a 3-year weighted moving average in which the registrations in the most recent year are given a weight of 2, and registratio other 2 years are each given a weight of 1, the forecasted registrations (in thousands) for years 4 through 12 are (round your respon one decimal place): 7 9 8 10 9 11 10 12 11 12

Practical Management Science
6th Edition
ISBN:9781337406659
Author:WINSTON, Wayne L.
Publisher:WINSTON, Wayne L.
Chapter13: Regression And Forecasting Models
Section13.6: Moving Averages Models
Problem 22P: The file P13_22.xlsx contains total monthly U.S. retail sales data. While holding out the final six...

Related questions
Question
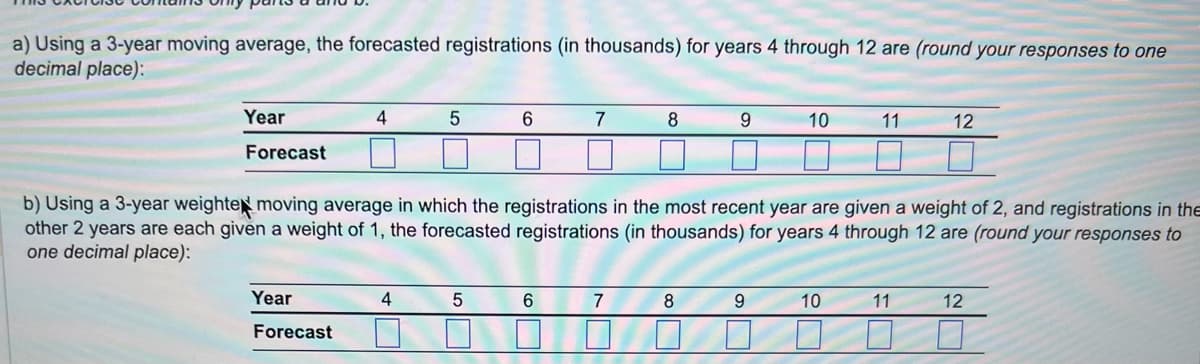
Transcribed Image Text:a) Using a 3-year moving average, the forecasted registrations (in thousands) for years 4 through 12 are (round your responses to one
decimal place):
Year
Forecast
4
Year
Forecast
5
4
6
5
7
6
8
b) Using a 3-year weighted moving average in which the registrations in the most recent year are given a weight of 2, and registrations in the
other 2 years are each given a weight of 1, the forecasted registrations (in thousands) for years 4 through 12 are (round your responses to
one decimal place):
7
9
8
10
9
11
10
12
11
12
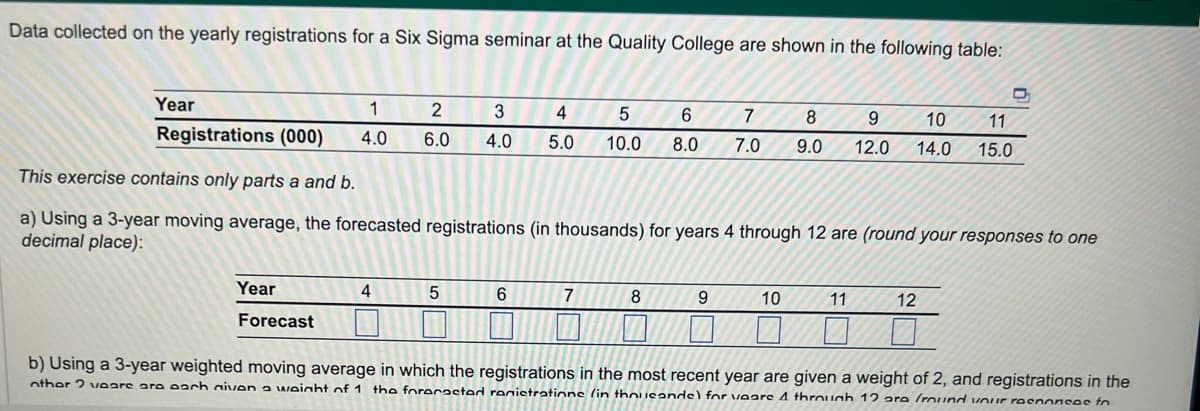
Transcribed Image Text:Data collected on the yearly registrations for a Six Sigma seminar at the Quality College are shown in the following table:
Year
1
4.0
Year
Forecast
2
6.0
4
3 4
4.0 5.0
5
Registrations (000)
This exercise contains only parts a and b.
a) Using a 3-year moving average, the forecasted registrations (in thousands) for years 4 through 12 are (round your responses to one
decimal place):
6
10
5 6 7 8 9
10.0 8.0 7.0 9.0 12.0 14.0
7
8
9
10
11
11
15.0
12
D
b) Using a 3-year weighted moving average in which the registrations in the most recent year are given a weight of 2, and registrations in the
nther 2 veare are each niven a weight of 1 the forecasted registratione (in thousande) for voare 4 through 12 are fround your roenoncos fo
Expert Solution
This question has been solved!
Explore an expertly crafted, step-by-step solution for a thorough understanding of key concepts.

This is a popular solution!

Trending now
This is a popular solution!

Step by step
Solved in 4 steps with 4 images

Recommended textbooks for you
Practical Management Science
Operations Management
ISBN:
9781337406659
Author:
WINSTON, Wayne L.
Publisher:
Cengage,
Practical Management Science
Operations Management
ISBN:
9781337406659
Author:
WINSTON, Wayne L.
Publisher:
Cengage,