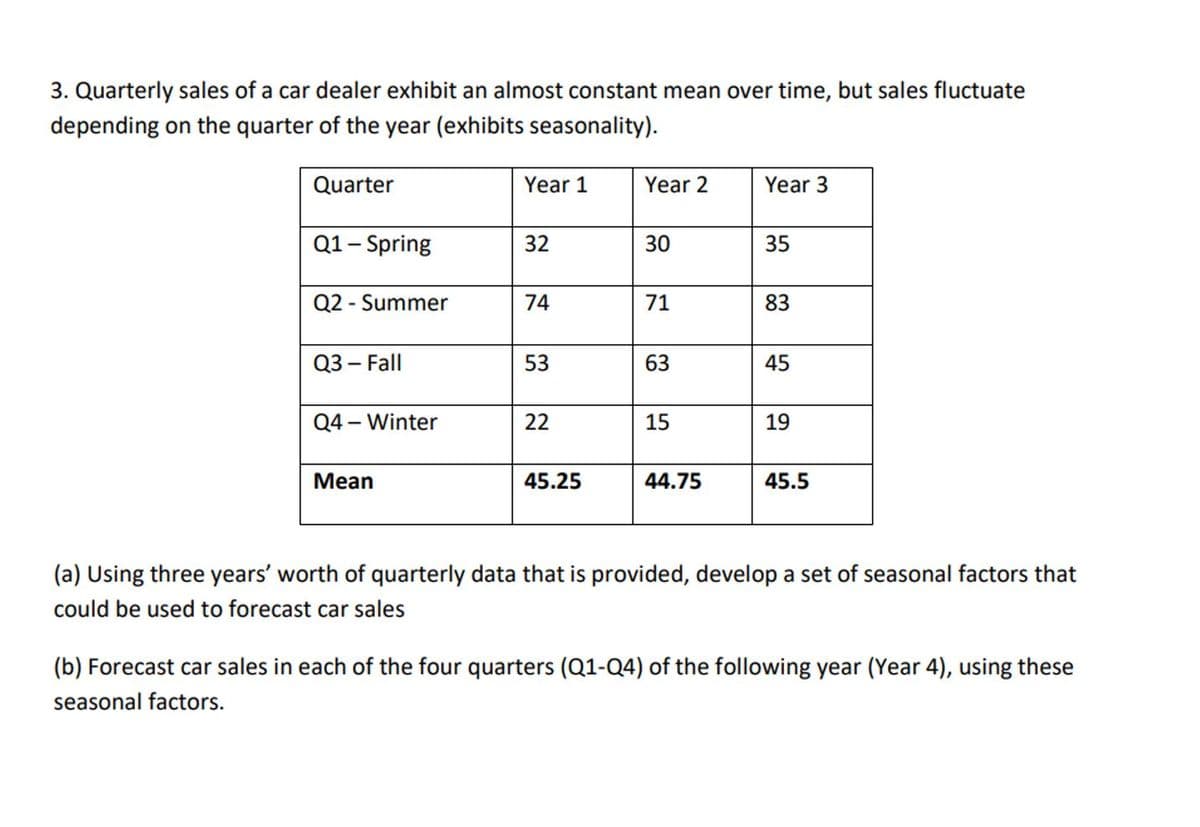
3. Quarterly sales of a car dealer exhibit an almost constant mean over time, but sales fluctuate depending on the quarter of the year (exhibits seasonality). Quarter Q1 - Spring Q2 - Summer Q3 - Fall Q4 - Winter Mean Year 1 32 74 53 22 45.25 Year 2 30 71 63 15 44.75 Year 3 35 83 45 19 45.5 (a) Using three years' worth of quarterly data that is provided, develop a set of seasonal factors that could be used to forecast car sales (b) Forecast car sales in each of the four quarters (Q1-Q4) of the following year (Year 4), using these seasonal factors.


Q: The McGranger Mortgage Company of Problem 6 made some changes to the process and undertook a process…
A: Given data: Upper Specification Limit (USL) = 25 Lower Specification Limit (LSL) = 5 Standard…
Q: Coordination is a process to achieve unity of action. In light of this statement discuss the…
A: Coordination is simply the sync between different employees and groups to work together in harmony…
Q: At Dot Com, a large retailer of popular books, demand is constant at 17,000 books per year. The cost…
A:
Q: Agreements between companies (partners) to reach objectives of common interest is known as ---------
A: Agreement is a legal documents where two parties/ companies are agree to something.
Q: a) Zed and Adrian run a small bicycle shop called "Z to A Bicycles". They must order bicycles for…
A: A cost payoff matrix is a tool used in operations management to evaluate the costs and benefits of a…
Q: You are brand manager at Arrow Cosmetics and responsible for Silkskin body lotion. Silkskin's annual…
A: Find the Given details below: Given details: Annual contribution 2.1 million Variable cost…
Q: following. Given the diagram above, please answer the following. 7. How many possible paths are…
A: NOTE: We are allowed to do one question only with three sub-parts. Thus, I am doing Part II-A and 3…
Q: Calculate the inventory carrying cost if weekly demand is 150 units, the value of the item is $70…
A: Inventory carrying cost identify the all unsold expense of the company. Weekly demand = 150 units…
Q: Is decision tree based on a linear combination of parameters ?
A: Many popular machine learning algorithms are based on decision trees. In both classification and…
Q: Write a short essay that explains how the balanced scorecard is different to the traditional ways of…
A: Balanced scorecard can be broadly defined as a performance management and strategic tool that is…
Q: Question: Cash Management Your company is a large distributor of iron rods. It sells approximately…
A: Given data is Annual demand(D) = 19000×12=2,28,000 tons Labor cost = 7 hours×75=525 CHF Logistic…
Q: a. Formulate an LP model for this problem. b. Implement your model in a spreadsheet and solve it.…
A: As per Bartleby guidelines, we can only solve the first three subparts of one question at a…
Q: When a variety of processes are active at once, how does the capacity analysis react?
A: Employees in the manufacturing sector often encounter situations when demand exceeds supply. These…
Q: project scheduling, the critical route approach is crucial, but what does it really do?
A: Critical path is the longest path on a project network diagram. In critical route approach, the…
Q: Predict orders for the following day for each of the products using an appropriate naive method.
A: A basic naive is chosen for more stable data as blueberry. Seasonal naive is chosen for data with…
Q: The measure of production that considers historical and estimated future production levels and…
A: Capacity can be stated as the term that defines the production amount that can be authorized to…
Q: Describe the importance of control over inventory ?
A: NOTE: We are allowed to do the first question only. Inventory management is all about calculating…
Q: Provide a quick example to explain the difference between risk segmentation and stratification.
A: Risk management can be stated as the approach of recognizing, evaluating, and handling or…
Q: Explain the link between operations management and strategic management
A: Operations management is the process of designing, implementing, and controlling the production and…
Q: Cost Classification Discussion Question The table below shows monthly data collected on production…
A: Add the given data in excel as follows.
Q: A linear programming computer package is needed. Frandec Company manufactures, assembles, and…
A: Decision Variables: Suppose-FM represents the number of frames manufacturedFP represents the…
Q: What exactly does it mean to "reap the advantages of a process" and why is it so important?
A: The threads connecting project outcomes to organizational strategy are benefits. Benefits are…
Q: Assume that each unit demanded of a company's product generates 66 USD in revenue and that each unit…
A: Profit or loss can be calculated by identifying the difference between total revenue and total…
Q: A company is planning to manufacture snowboards. The fixed costs are $128 per day and the total…
A: Production is the process in which inputs are combined to have the required output. It includes a…
Q: Explain the difference between the intelligence and design phases and why the former must be…
A: Introduction: A person's decision-making process is the series of steps they take to discover the…
Q: Are affirmative action policies are unjust because they discriminate against white men?
A: Affirmative action policies are designed to expand opportunities for people who have been…
Q: Find solution using simplex method. Maximize z = 4x₁ + 3x₂ Subject to the constraints 2x₁ + x₂ ≤…
A: Linear Programming is a mathematical and statistical technique used in operations that help…
Q: Why would demand forecasting make sense in a “make to stock” situation?
A: Make to stock is a strategy in production where most of the companies employ to match the consumer…
Q: What is the coefficient?
A: Forecasting is a technique used to predict future outcomes on the basis of past data. In business…
Q: Determine the best crop to plant, using the following decision criteria: a) Maximax b) Maximin c)…
A: NOTE: We are allowed to do the first three sub-parts only. Maximin:This is the most conservative…
Q: Explain how the capacity analysis reacts when several processes are running simultaneously.
A: The capacity analysis is a tool that can be used to calculate the maximum throughput of a system. It…
Q: Daily demand of a product is 240 units and the assembly line operates 8-hour per day. The task times…
A: Project schedule helps in calculating different values all related to the production cycle like the…
Q: The term for safety time added to chains other than the critical chain is: Feeding buffer, first…
A: Feeding Buffer: It is a safety added to the places where chains of tasks which are non critical…
Q: Which approach—agile or waterfall—do you think is better for a project with clear objectives and…
A: As per Bartleby's honor code, we can not provide any reference for the solution. THANK YOU.....…
Q: Select the best answer for the question. 4. A supply chain consulting firm offers by its nature OA.…
A: Supply chain consulting firms offer advice to businesses on how to improve their supply chains. They…
Q: Do you think this is true? Supply chain management systems are outside oriented, while enterprise…
A: Supply chain management experts believe that in order for companies to remain competitive, they must…
Q: The manager of a company wishes to assign three jobs to four machines on one-on-one basis. The cost…
A: The assignment problem is solved to arrive at the optimal solution so as to reduce cost or maximize…
Q: [item no.15] A company uses the production run model to determine the number of t-shirts that must…
A:
Q: 1. Can a project have two critical paths? Why or why not? Give a brief example to illustrate your…
A: The critical route approach is a popular and beneficial technique for determining the ideal sequence…
Q: Critically discuss early project termination within a project organisation.
A: Within a project organization, both the project team and the stakeholders making the decision find…
Q: Your organization is considering refurbishing your office building, as a facility manager, you have…
A: Sustainable development:- Maintaining the capacity of natural systems to continue delivering the…
Q: If an assembly line with 11 tasks has a cycle time of 40 seconds per unit and the total task time is…
A: Cycle time is the time which worker actually spend in producing the item or providing the service to…
Q: When a variety of processes are active at once, how does the capacity analysis react?
A: Capacity analysis is a process that determines the level of demand for a product or service. It can…
Q: Iron Works, Inc. manufactures two products made from steel and receives 2000 pounds of steel each…
A: Assume Product 1 = x Product 2 = y
Q: How do supply chain management, customer relationship management, and transaction processing…
A: Supply chain management is defined as a set of approaches utilized to integrate suppliers,…
Q: Wolfgang Kersten Mfg. intends to increase capacity through the addition of new equipment. Two…
A: For the proposal X Fixed cost(FC)= 150,000 Variable cost(VC) = 120 For the…
Q: Company Ajax has the following information from its financial statements in 2021. The annual sales…
A: Cash to cash cycle time refers to the period between paying cash to the supplier or receiving cash…
Q: Consider an expensive part with a reliability of 96.6%. If the part fails, it will cost the firm…
A: Note: - As we can answer up to three subparts, we will first question and its subparts. If an answer…
Q: A retail catalog operation employs a bank of six telephone operators who process orders using…
A:
Q: 6.4: An order for 50 of a product is processed on work centers A and B. The setup time on A is 45…
A: Manufacturing lead time is the time for processing, preparing materials, manufacturing, and…


Trending now
This is a popular solution!

Step by step
Solved in 2 steps with 2 images

- The owner of a restaurant in Bloomington, Indiana, has recorded sales data for the past 19 years. He has also recorded data on potentially relevant variables. The data are listed in the file P13_17.xlsx. a. Estimate a simple regression equation involving annual sales (the dependent variable) and the size of the population residing within 10 miles of the restaurant (the explanatory variable). Interpret R-square for this regression. b. Add another explanatory variableannual advertising expendituresto the regression equation in part a. Estimate and interpret this expanded equation. How does the R-square value for this multiple regression equation compare to that of the simple regression equation estimated in part a? Explain any difference between the two R-square values. How can you use the adjusted R-squares for a comparison of the two equations? c. Add one more explanatory variable to the multiple regression equation estimated in part b. In particular, estimate and interpret the coefficients of a multiple regression equation that includes the previous years advertising expenditure. How does the inclusion of this third explanatory variable affect the R-square, compared to the corresponding values for the equation of part b? Explain any changes in this value. What does the adjusted R-square for the new equation tell you?The file P13_22.xlsx contains total monthly U.S. retail sales data. While holding out the final six months of observations for validation purposes, use the method of moving averages with a carefully chosen span to forecast U.S. retail sales in the next year. Comment on the performance of your model. What makes this time series more challenging to forecast?The file P13_02.xlsx contains five years of monthly data on sales (number of units sold) for a particular company. The company suspects that except for random noise, its sales are growing by a constant percentage each month and will continue to do so for at least the near future. a. Explain briefly whether the plot of the series visually supports the companys suspicion. b. By what percentage are sales increasing each month? c. What is the MAPE for the forecast model in part b? In words, what does it measure? Considering its magnitude, does the model seem to be doing a good job? d. In words, how does the model make forecasts for future months? Specifically, given the forecast value for the last month in the data set, what simple arithmetic could you use to obtain forecasts for the next few months?
- Management of a home appliance store wants to understand the growth pattern of the monthly sales of a new technology device over the past two years. The managers have recorded the relevant data in the file P13_05.xlsx. Have the sales of this device been growing linearly over the past 24 months? By examining the results of a linear trend line, explain why or why not.Do the sales prices of houses in a given community vary systematically with their sizes (as measured in square feet)? Answer this question by estimating a simple regression equation where the sales price of the house is the dependent variable, and the size of the house is the explanatory variable. Use the sample data given in P13_06.xlsx. Interpret your estimated equation, the associated R-square value, and the associated standard error of estimate.Suppose that a regional express delivery service company wants to estimate the cost of shipping a package (Y) as a function of cargo type, where cargo type includes the following possibilities: fragile, semifragile, and durable. Costs for 15 randomly chosen packages of approximately the same weight and same distance shipped, but of different cargo types, are provided in the file P13_16.xlsx. a. Estimate a regression equation using the given sample data, and interpret the estimated regression coefficients. b. According to the estimated regression equation, which cargo type is the most costly to ship? Which cargo type is the least costly to ship? c. How well does the estimated equation fit the given sample data? How might the fit be improved? d. Given the estimated regression equation, predict the cost of shipping a package with semifragile cargo.
- The file P13_42.xlsx contains monthly data on consumer revolving credit (in millions of dollars) through credit unions. a. Use these data to forecast consumer revolving credit through credit unions for the next 12 months. Do it in two ways. First, fit an exponential trend to the series. Second, use Holts method with optimized smoothing constants. b. Which of these two methods appears to provide the best forecasts? Answer by comparing their MAPE values.A small computer chip manufacturer wants to forecast monthly ozperating costs as a function of the number of units produced during a month. The company has collected the 16 months of data in the file P13_34.xlsx. a. Determine an equation that can be used to predict monthly production costs from units produced. Are there any outliers? b. How could the regression line obtained in part a be used to determine whether the company was efficient or inefficient during any particular month?The file P13_26.xlsx contains the monthly number of airline tickets sold by the CareFree Travel Agency. a. Create a time series chart of the data. Based on what you see, which of the exponential smoothing models do you think will provide the best forecasting model? Why? b. Use simple exponential smoothing to forecast these data, using a smoothing constant of 0.1. c. Repeat part b, but search for the smoothing constant that makes RMSE as small as possible. Does it make much of an improvement over the model in part b?
- Management of a home appliance store would like to understand the growth pattern of the monthly sales of Blu-ray disc players over the past two years. Managers have recorded the relevant data in the file P13_33.xlsx. a. Create a scatterplot for these data. Comment on the observed behavior of monthly sales at this store over time. b. Estimate an appropriate regression equation to explain the variation of monthly sales over the given time period. Interpret the estimated regression coefficients. c. Analyze the estimated equations residuals. Do they suggest that the regression equation is adequate? If not, return to part b and revise your equation. Continue to revise the equation until the results are satisfactory.The file P13_29.xlsx contains monthly time series data for total U.S. retail sales of building materials (which includes retail sales of building materials, hardware and garden supply stores, and mobile home dealers). a. Is seasonality present in these data? If so, characterize the seasonality pattern. b. Use Winters method to forecast this series with smoothing constants = = 0.1 and = 0.3. Does the forecast series seem to track the seasonal pattern well? What are your forecasts for the next 12 months?The file P13_28.xlsx contains monthly retail sales of U.S. liquor stores. a. Is seasonality present in these data? If so, characterize the seasonality pattern. b. Use Winters method to forecast this series with smoothing constants = = 0.1 and = 0.3. Does the forecast series seem to track the seasonal pattern well? What are your forecasts for the next 12 months?