a) Using a weighted moving average with three periods, determine the demand for period 13. Use 3, 2, and 1 for the weights of the most recent, second most recent, and third most recent periods, respectively b) Find the MAD, MSE and MAPE b) Use exponential smoothing with a smoothing constant of 0.30 to forecast the sales. Assume that last period's forecast for month 1 is equal to actual to begin the procedure Which method do you think is best? Is this an improvement over the weighted average- use MAD onl·
a) Using a weighted moving average with three periods, determine the demand for period 13. Use 3, 2, and 1 for the weights of the most recent, second most recent, and third most recent periods, respectively b) Find the MAD, MSE and MAPE b) Use exponential smoothing with a smoothing constant of 0.30 to forecast the sales. Assume that last period's forecast for month 1 is equal to actual to begin the procedure Which method do you think is best? Is this an improvement over the weighted average- use MAD onl·

Practical Management Science
6th Edition
ISBN:9781337406659
Author:WINSTON, Wayne L.
Publisher:WINSTON, Wayne L.
Chapter13: Regression And Forecasting Models
Section13.7: Exponential Smoothing Models
Problem 26P: The file P13_26.xlsx contains the monthly number of airline tickets sold by the CareFree Travel...

Related questions
Question
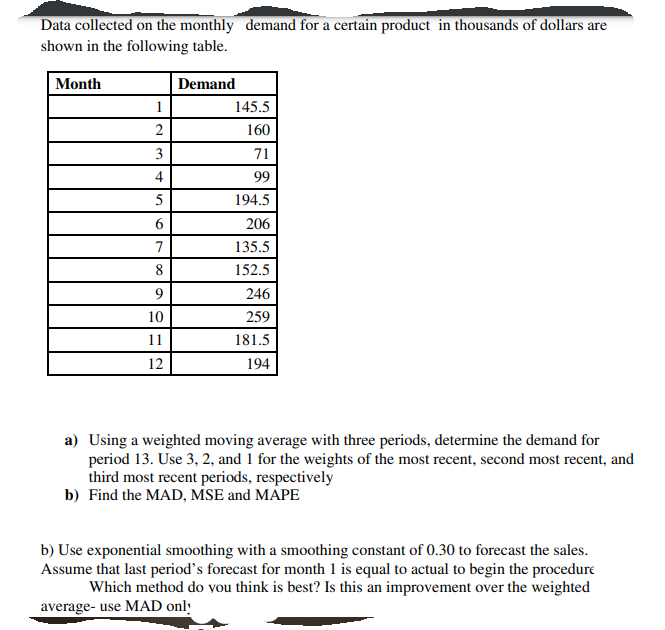
Transcribed Image Text:Data collected on the monthly demand for a certain product in thousands of dollars are
shown in the following table.
Month
Demand
1
145.5
2
160
3
71
4
99
5
194.5
206
7
135.5
8
152.5
9.
246
10
259
11
181.5
12
194
a) Using a weighted moving average with three periods, determine the demand for
period 13. Use 3, 2, and 1 for the weights of the most recent, second most recent, and
third most recent periods, respectively
b) Find the MAD, MSE and MAPE
b) Use exponential smoothing with a smoothing constant of 0.30 to forecast the sales.
Assume that last period's forecast for month 1 is equal to actual to begin the procedure
Which method do you think is best? Is this an improvement over the weighted
average- use MAD only
Expert Solution
This question has been solved!
Explore an expertly crafted, step-by-step solution for a thorough understanding of key concepts.

This is a popular solution!

Trending now
This is a popular solution!

Step by step
Solved in 2 steps with 19 images

Recommended textbooks for you
Practical Management Science
Operations Management
ISBN:
9781337406659
Author:
WINSTON, Wayne L.
Publisher:
Cengage,
Practical Management Science
Operations Management
ISBN:
9781337406659
Author:
WINSTON, Wayne L.
Publisher:
Cengage,