Passenger miles flown on Northeast Airlines, a commuter firm serving the Boston hub, are shown for the past 12 weeks: Week 1 2 3 4 6 7 8 9 10 11 12 Actual Passenger Miles (in thousands) 17 21 19 23 18 16 20 18 22 20 15 22 a) Assuming an initial forecast for week 1 of 17,000 miles, use exponential smoothing to compute miles for weeks 2 through 12. Use a = 0.2 (round your responses to two decimal places). Week 1 2 3 4 6 7 8 9 10 11 12 Forecasted Passenger Miles (in thousands) 17.00 17.00 17.80 18.04 19.03 18.83 18.26 18.61 18.49 19.19
Passenger miles flown on Northeast Airlines, a commuter firm serving the Boston hub, are shown for the past 12 weeks: Week 1 2 3 4 6 7 8 9 10 11 12 Actual Passenger Miles (in thousands) 17 21 19 23 18 16 20 18 22 20 15 22 a) Assuming an initial forecast for week 1 of 17,000 miles, use exponential smoothing to compute miles for weeks 2 through 12. Use a = 0.2 (round your responses to two decimal places). Week 1 2 3 4 6 7 8 9 10 11 12 Forecasted Passenger Miles (in thousands) 17.00 17.00 17.80 18.04 19.03 18.83 18.26 18.61 18.49 19.19

Practical Management Science
6th Edition
ISBN:9781337406659
Author:WINSTON, Wayne L.
Publisher:WINSTON, Wayne L.
Chapter13: Regression And Forecasting Models
Section13.7: Exponential Smoothing Models
Problem 26P: The file P13_26.xlsx contains the monthly number of airline tickets sold by the CareFree Travel...

Related questions
Question
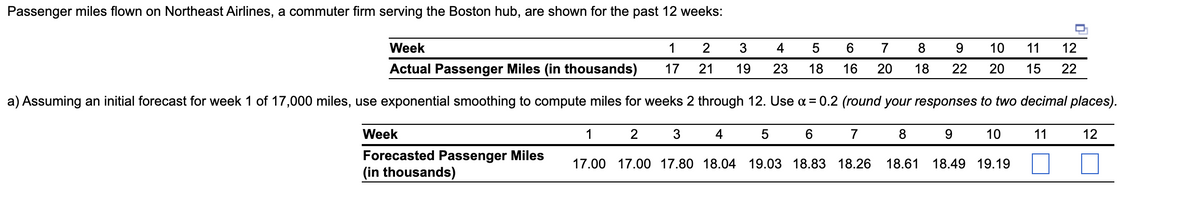
Transcribed Image Text:Passenger miles flown on Northeast Airlines, a commuter firm serving the Boston hub, are shown for the past 12 weeks:
Week
1
2
4
5
6.
7
8
9.
10
11
12
Actual Passenger Miles (in thousands)
17
21
19
23
18
16
20
18
22
20
15
22
a) Assuming an initial forecast for week 1 of 17,000 miles, use exponential smoothing to compute miles for weeks 2 through 12. Use a = 0.2 (round your responses to two decimal places).
Week
1
2
3
4
6.
7
8.
10
11
12
Forecasted Passenger Miles
(in thousands)
17.00 17.00 17.80 18.04 19.03 18.83 18.26
18.61 18.49 19.19
Expert Solution
This question has been solved!
Explore an expertly crafted, step-by-step solution for a thorough understanding of key concepts.

This is a popular solution!

Trending now
This is a popular solution!

Step by step
Solved in 3 steps with 3 images

Recommended textbooks for you
Practical Management Science
Operations Management
ISBN:
9781337406659
Author:
WINSTON, Wayne L.
Publisher:
Cengage,

Contemporary Marketing
Marketing
ISBN:
9780357033777
Author:
Louis E. Boone, David L. Kurtz
Publisher:
Cengage Learning

Marketing
Marketing
ISBN:
9780357033791
Author:
Pride, William M
Publisher:
South Western Educational Publishing
Practical Management Science
Operations Management
ISBN:
9781337406659
Author:
WINSTON, Wayne L.
Publisher:
Cengage,
Contemporary Marketing
Marketing
ISBN:
9780357033777
Author:
Louis E. Boone, David L. Kurtz
Publisher:
Cengage Learning
Marketing
Marketing
ISBN:
9780357033791
Author:
Pride, William M
Publisher:
South Western Educational Publishing