(a) What is the level of significance? State the null and alternate hypotheses. O Ho: p < 0 .7; Hiip = 0.7 Hoip # 0.7; H1: p = 0.7 O Ho:p = 0.7; H,: p > 0.7 Ho:p = 0.7; H1: p # 0.7 %3D Ho:p = 0 .7; Hip < 0.7 (b) What sampling distribution will you use? The standard normal, since np > 5 and nq > 5. O The Student's t, since np > 5 and nq > 5. The Student's t, since np < 5 and nq < 5. The standard normal, since np < 5 and nq < 5. What is the value of the sample test statistic? (Round your answer to two decimal places.) (c) Find the P-value of the test statistic. (Round your answer to four decimal places.)
(a) What is the level of significance? State the null and alternate hypotheses. O Ho: p < 0 .7; Hiip = 0.7 Hoip # 0.7; H1: p = 0.7 O Ho:p = 0.7; H,: p > 0.7 Ho:p = 0.7; H1: p # 0.7 %3D Ho:p = 0 .7; Hip < 0.7 (b) What sampling distribution will you use? The standard normal, since np > 5 and nq > 5. O The Student's t, since np > 5 and nq > 5. The Student's t, since np < 5 and nq < 5. The standard normal, since np < 5 and nq < 5. What is the value of the sample test statistic? (Round your answer to two decimal places.) (c) Find the P-value of the test statistic. (Round your answer to four decimal places.)

MATLAB: An Introduction with Applications
6th Edition
ISBN:9781119256830
Author:Amos Gilat
Publisher:Amos Gilat
Chapter1: Starting With Matlab
Section: Chapter Questions
Problem 1P

Related questions

Topic Video
Question
Is the national crime rate really going down? Some sociologists say yes! They say that the reason for the decline in crime rates in the 1980s and 1990s is demographics. It seems that the population is aging, and older people commit fewer crimes. According to the FBI and the Justice Department, 70% of all arrests are of males aged 15 to 34 years†. Suppose you are a sociologist in Rock Springs, Wyoming, and a random sample of police files showed that of 37 arrests last month, 22 were of males aged 15 to 34 years. Use a 10% level of significance to test the claim that the population proportion of such arrests in Rock Springs is different from 70%.
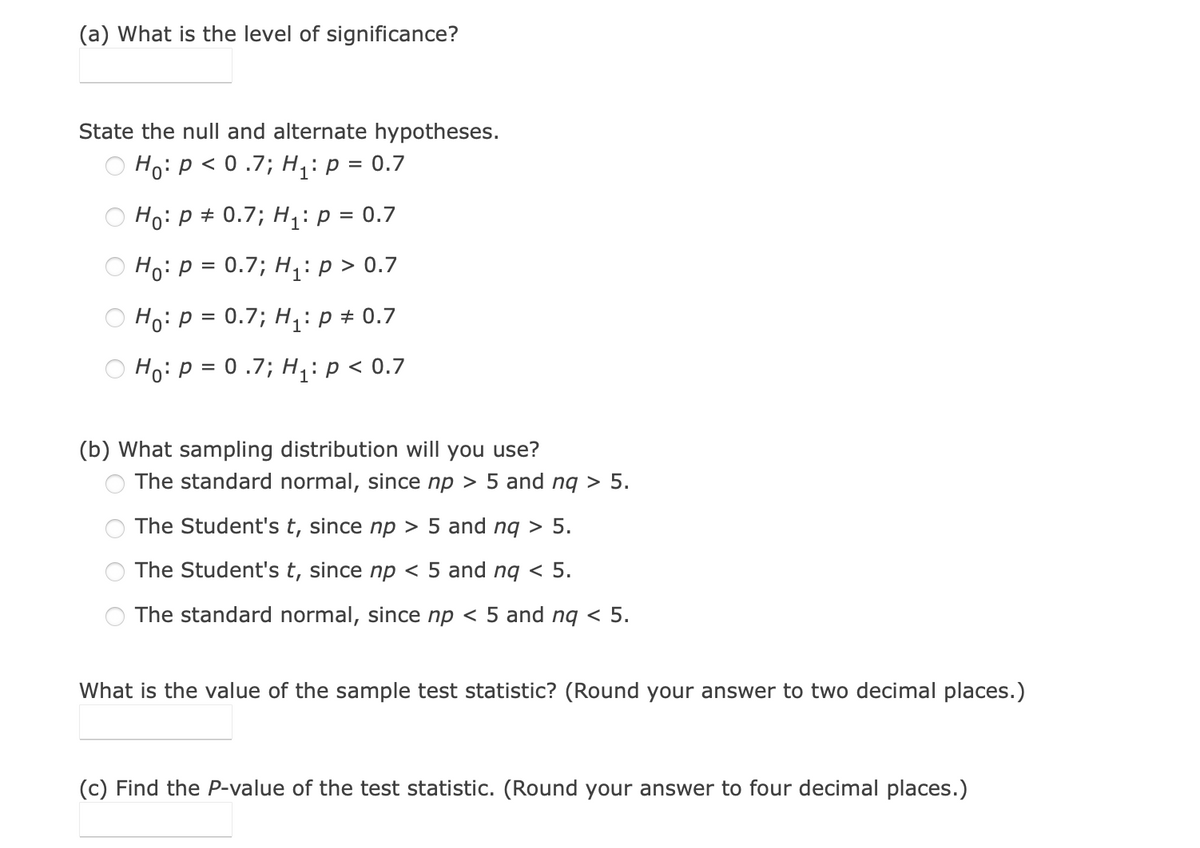
Transcribed Image Text:(a) What is the level of significance?
State the null and alternate hypotheses.
Hoip<
< 0.7; H,: p = 0.7
Ho: p + 0.7; H;: p = 0.7
O Ho: p = 0.7; H, : p > 0.7
%D
O Ho: p = 0.7; H;: p + 0.7
O Ho: P = 0 .7; H:p < 0.7
(b) What sampling distribution will you use?
The standard normal, since np > 5 and nq > 5.
The Student's t, since np > 5 and nq > 5.
The Student's t, since np < 5 and ng < 5.
The standard normal, since np < 5 and nq < 5.
What is the value of the sample test statistic? (Round your answer to two decimal places.)
(c) Find the P-value of the test statistic. (Round your answer to four decimal places.)
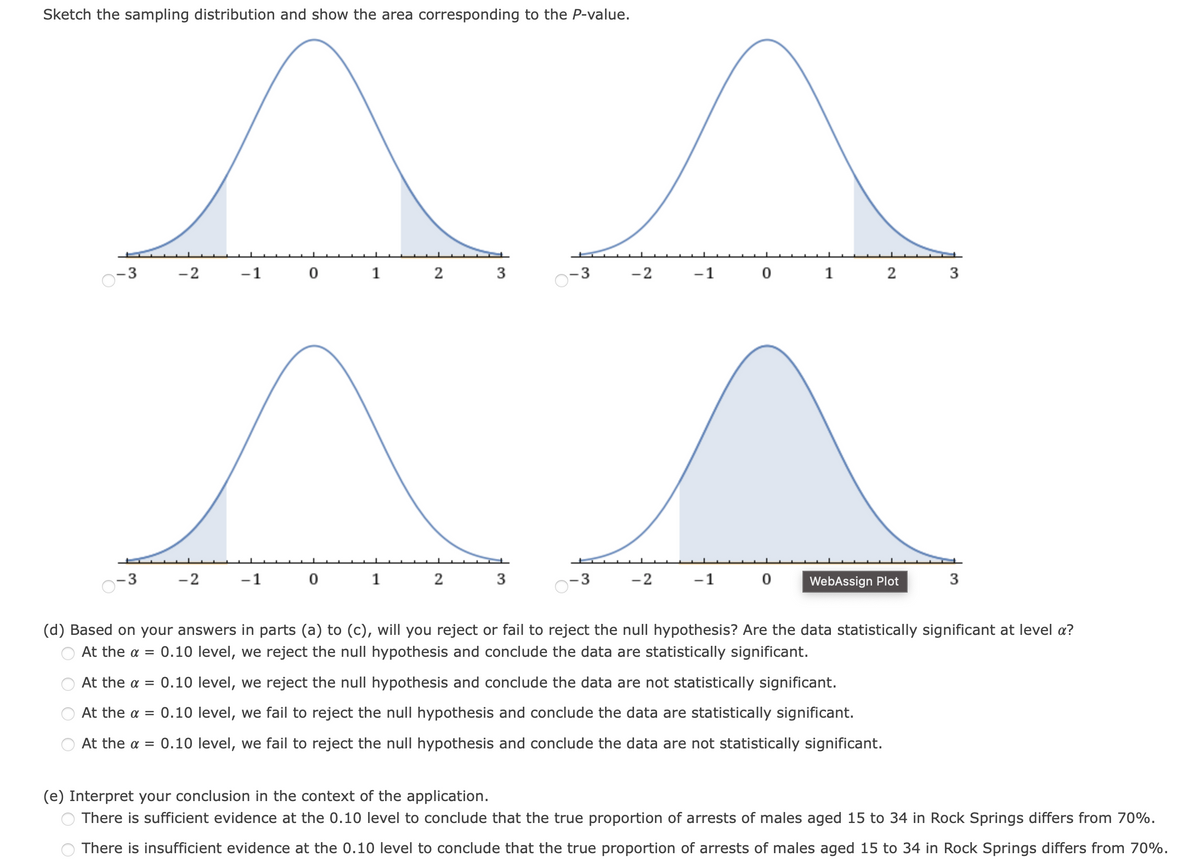
Transcribed Image Text:Sketch the sampling distribution and show the area corresponding to the P-value.
-3
-2
1
2
3
3
-2
-1
1
2
3
-2
-1
1
3
3
-2
-1
WebAssign Plot
3
(d) Based on your answers in parts (a) to (c), will you reject or fail to reject the null hypothesis? Are the data statistically significant at level a?
At the a = 0.10 level, we reject the null hypothesis and conclude the data are statistically significant.
At the a = 0.10 level, we reject the null hypothesis and conclude the data are not statistically significant.
At the a = 0.10 level, we fail to reject the null hypothesis and conclude the data are statistically significant.
At the a = 0.10 level, we fail to reject the null hypothesis and conclude the data are not statistically significant.
(e) Interpret your conclusion in the context of the application.
There is sufficient evidence at the 0.10 level to conclude that the true proportion of arrests of males aged 15 to 34 in Rock Springs differs from 70%.
O There is insufficient evidence at the 0.10 level to conclude that the true proportion of arrests of males aged 15 to 34 in Rock Springs differs from 70%.
Expert Solution
This question has been solved!
Explore an expertly crafted, step-by-step solution for a thorough understanding of key concepts.

Step by step
Solved in 4 steps with 5 images

Knowledge Booster


Learn more about
Need a deep-dive on the concept behind this application? Look no further. Learn more about this topic, statistics and related others by exploring similar questions and additional content below.Recommended textbooks for you
MATLAB: An Introduction with Applications
Statistics
ISBN:
9781119256830
Author:
Amos Gilat
Publisher:
John Wiley & Sons Inc

Probability and Statistics for Engineering and th…
Statistics
ISBN:
9781305251809
Author:
Jay L. Devore
Publisher:
Cengage Learning

Statistics for The Behavioral Sciences (MindTap C…
Statistics
ISBN:
9781305504912
Author:
Frederick J Gravetter, Larry B. Wallnau
Publisher:
Cengage Learning
MATLAB: An Introduction with Applications
Statistics
ISBN:
9781119256830
Author:
Amos Gilat
Publisher:
John Wiley & Sons Inc
Probability and Statistics for Engineering and th…
Statistics
ISBN:
9781305251809
Author:
Jay L. Devore
Publisher:
Cengage Learning
Statistics for The Behavioral Sciences (MindTap C…
Statistics
ISBN:
9781305504912
Author:
Frederick J Gravetter, Larry B. Wallnau
Publisher:
Cengage Learning

Elementary Statistics: Picturing the World (7th E…
Statistics
ISBN:
9780134683416
Author:
Ron Larson, Betsy Farber
Publisher:
PEARSON

The Basic Practice of Statistics
Statistics
ISBN:
9781319042578
Author:
David S. Moore, William I. Notz, Michael A. Fligner
Publisher:
W. H. Freeman

Introduction to the Practice of Statistics
Statistics
ISBN:
9781319013387
Author:
David S. Moore, George P. McCabe, Bruce A. Craig
Publisher:
W. H. Freeman