a) What is the probability that the system works? Assume the components fail independently. b) Given that the system works, what is the probability that the component B is not working.
a) What is the probability that the system works? Assume the components fail independently. b) Given that the system works, what is the probability that the component B is not working.

Algebra & Trigonometry with Analytic Geometry
13th Edition
ISBN:9781133382119
Author:Swokowski
Publisher:Swokowski
Chapter10: Sequences, Series, And Probability
Section10.8: Probability
Problem 31E

Related questions
Question
100%
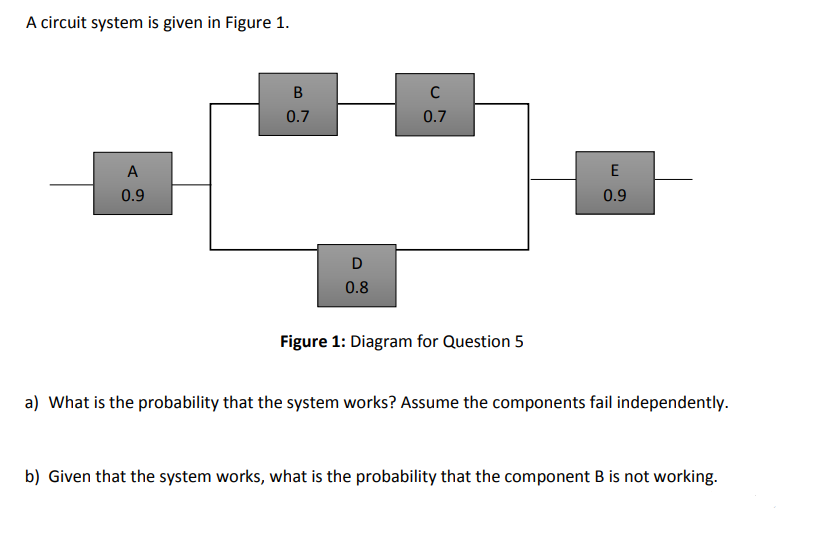
Transcribed Image Text:A circuit system is given in Figure 1.
B
0.7
0.7
A
E
0.9
0.9
D
0.8
Figure 1: Diagram for Question 5
a) What is the probability that the system works? Assume the components fail independently.
b) Given that the system works, what is the probability that the component B is not working.
Expert Solution
This question has been solved!
Explore an expertly crafted, step-by-step solution for a thorough understanding of key concepts.

This is a popular solution!

Trending now
This is a popular solution!

Step by step
Solved in 3 steps with 3 images

Recommended textbooks for you
Algebra & Trigonometry with Analytic Geometry
Algebra
ISBN:
9781133382119
Author:
Swokowski
Publisher:
Cengage
Algebra & Trigonometry with Analytic Geometry
Algebra
ISBN:
9781133382119
Author:
Swokowski
Publisher:
Cengage