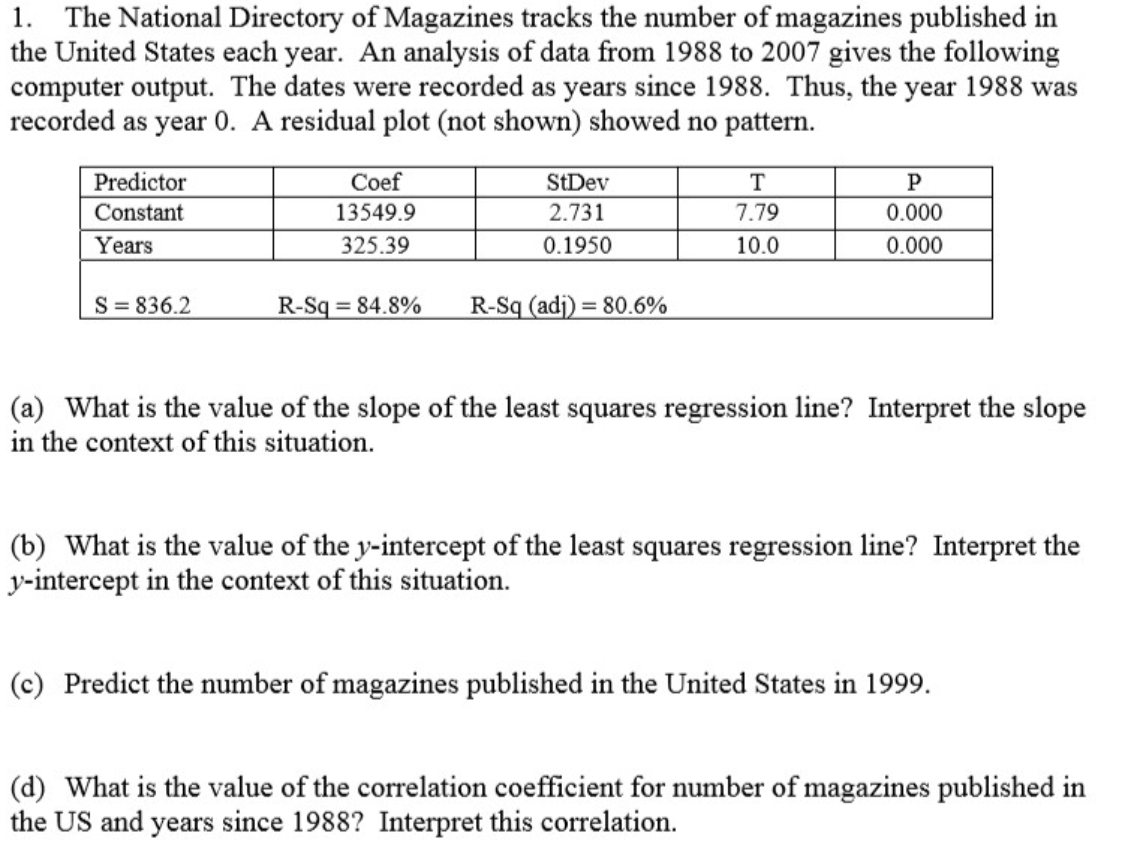
(a) What is the value of the slope of the least squares regression line? Interpret the slope in the context of this situation. (b) What is the value of the y-intercept of the least squares regression line? Interpret the y-intercept in the context of this situation. (c) Predict the number of magazines published in the United States in 1999. (d) What is the value of the correlation coefficient for number of magazines published in the US and years since 1988? Interpret this correlation.

Linear Algebra: A Modern Introduction
4th Edition
ISBN:9781285463247
Author:David Poole
Publisher:David Poole
Chapter7: Distance And Approximation
Section7.3: Least Squares Approximation
Problem 31EQ
icon
Related questions
icon
Concept explainers
Question
1. The National Directory of Magazines tracks the number of magazines published in
the United States each year. An analysis of data from 1988 to 2007 gives the following
computer output. The dates were recorded as years since 1988. Thus, the year 1988 was
recorded as year 0. A residual plot (not shown) showed no pattern.
Predictor
Coef
StDev
T
Constant
13549.9
2.731
7.79
0.000
Years
325.39
0.1950
10.0
0.000
S= 836.2
R-Sq = 84.8%
R-Sq (adj) = 80.6%
(a) What is the value of the slope of the least squares regression line? Interpret the slope
in the context of this situation.
(b) What is the value of the y-intercept of the least squares regression line? Interpret the
y-intercept in the context of this situation.
(c) Predict the number of magazines published in the United States in 1999.
(d) What is the value of the correlation coefficient for number of magazines published in
the US and years since 1988? Interpret this correlation.
Transcribed Image Text:1. The National Directory of Magazines tracks the number of magazines published in the United States each year. An analysis of data from 1988 to 2007 gives the following computer output. The dates were recorded as years since 1988. Thus, the year 1988 was recorded as year 0. A residual plot (not shown) showed no pattern. Predictor Coef StDev T Constant 13549.9 2.731 7.79 0.000 Years 325.39 0.1950 10.0 0.000 S= 836.2 R-Sq = 84.8% R-Sq (adj) = 80.6% (a) What is the value of the slope of the least squares regression line? Interpret the slope in the context of this situation. (b) What is the value of the y-intercept of the least squares regression line? Interpret the y-intercept in the context of this situation. (c) Predict the number of magazines published in the United States in 1999. (d) What is the value of the correlation coefficient for number of magazines published in the US and years since 1988? Interpret this correlation.
Expert Solution
trending now

Trending now

This is a popular solution!

steps

Step by step

Solved in 4 steps

Blurred answer
Knowledge Booster
Correlation, Regression, and Association
Learn more about
Need a deep-dive on the concept behind this application? Look no further. Learn more about this topic, statistics and related others by exploring similar questions and additional content below.
Recommended textbooks for you
Linear Algebra: A Modern Introduction
Algebra
ISBN:
9781285463247
Author:
David Poole
Publisher:
Cengage Learning