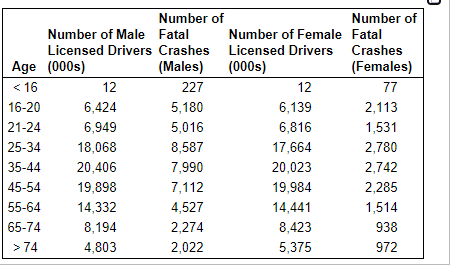
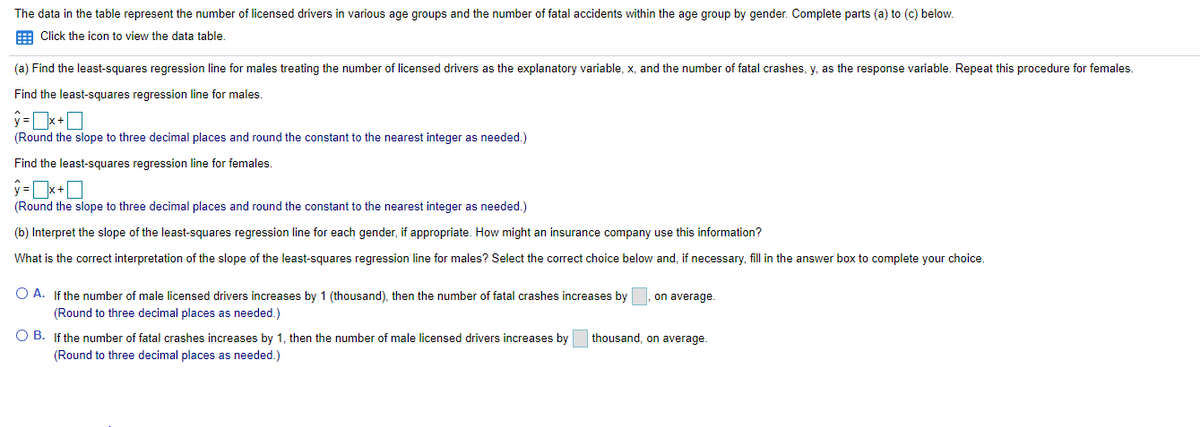
The data in the table represent the number of licensed drivers in various age groups and the number of fatal accidents within the age group by gender. Complete parts (a) to (c) below. E Click the icon to view the data table. (a) Find the least-squares regression line for males treating the number of licensed drivers as the explanatory variable, x, and the number of fatal crashes, y, as the response variable. Repeat this procedure for females. Find the least-squares regression line for males. (Round the slope to three decimal places and round the constant to the nearest integer as needed.) Find the least-squares regression line for females. (Round the slope to three decimal places and round the constant to the nearest integer as needed.) (b) Interpret the slope of the least-squares regression line for each gender, if appropriate. How might an insurance company use this information? What is the correct interpretation of the slope of the least-squares regression line for males? Select the correct choice below and, if necessary, fill in the answer box to complete your choice. O A. If the number of male licensed drivers increases by 1 (thousand), then the number of fatal crashes increases by, on average. (Round to three decimal places as needed.) O B. If the number of fatal crashes increases by 1, then the number of male licensed drivers increases by thousand, on average (Round to three decimal places as needed.)


Correlation
Correlation defines a relationship between two independent variables. It tells the degree to which variables move in relation to each other. When two sets of data are related to each other, there is a correlation between them.
Linear Correlation
A correlation is used to determine the relationships between numerical and categorical variables. In other words, it is an indicator of how things are connected to one another. The correlation analysis is the study of how variables are related.
Regression Analysis
Regression analysis is a statistical method in which it estimates the relationship between a dependent variable and one or more independent variable. In simple terms dependent variable is called as outcome variable and independent variable is called as predictors. Regression analysis is one of the methods to find the trends in data. The independent variable used in Regression analysis is named Predictor variable. It offers data of an associated dependent variable regarding a particular outcome.


Trending now
This is a popular solution!

Step by step
Solved in 3 steps with 1 images


