(a) What was the most frequent outcome of the experiment? 7 (b) What as the least frequent? 2 (c) How many times did we observe a 5?
(a) What was the most frequent outcome of the experiment? 7 (b) What as the least frequent? 2 (c) How many times did we observe a 5?

Glencoe Algebra 1, Student Edition, 9780079039897, 0079039898, 2018
18th Edition
ISBN:9780079039897
Author:Carter
Publisher:Carter
Chapter10: Statistics
Section: Chapter Questions
Problem 13PT

Related questions

Concept explainers
Contingency Table
A contingency table can be defined as the visual representation of the relationship between two or more categorical variables that can be evaluated and registered. It is a categorical version of the scatterplot, which is used to investigate the linear relationship between two variables. A contingency table is indeed a type of frequency distribution table that displays two variables at the same time.
Binomial Distribution
Binomial is an algebraic expression of the sum or the difference of two terms. Before knowing about binomial distribution, we must know about the binomial theorem.
Topic Video
Question
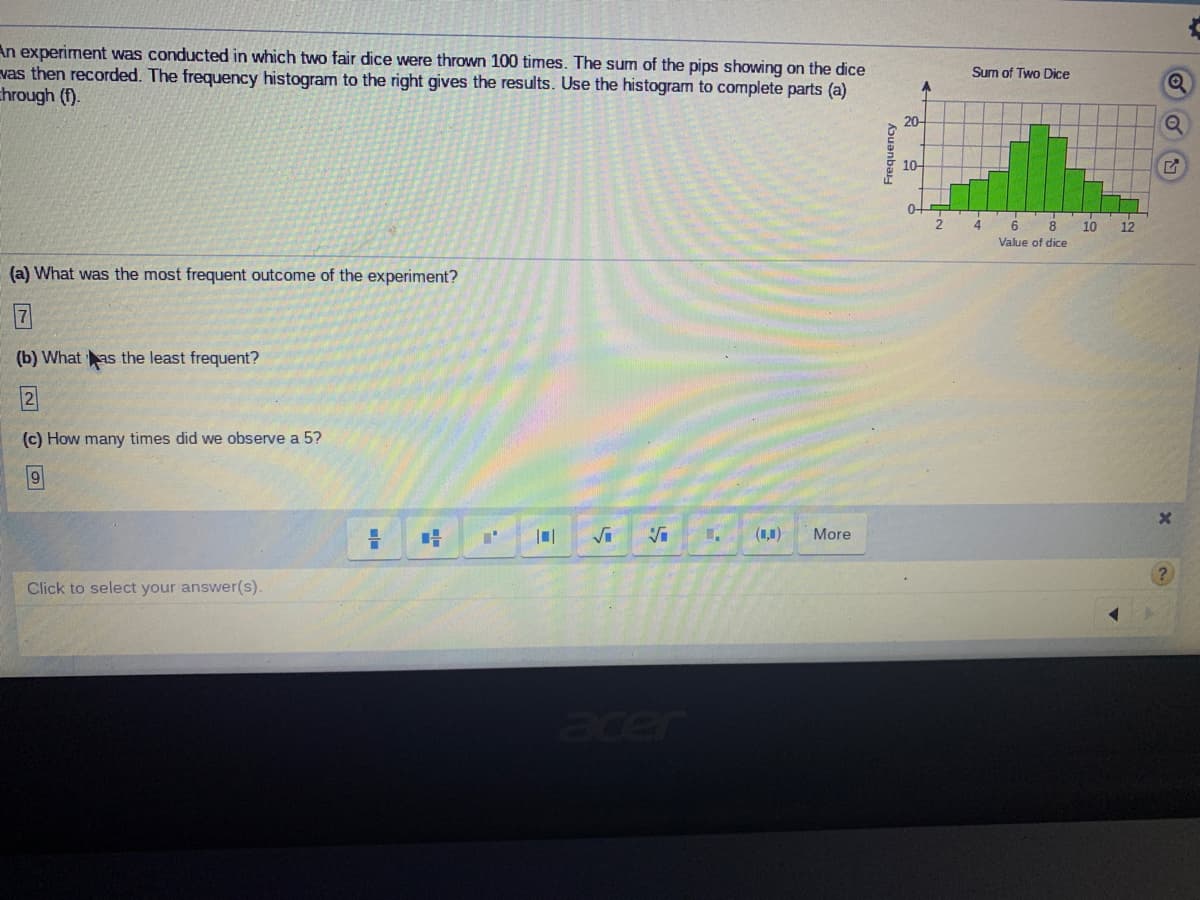
Transcribed Image Text:An experiment was conducted in which two fair dice were thrown 100 times. The sum of the pips showing on the dice
vas then recorded. The frequency histogram to the right gives the results. Use the histogram to complete parts (a)
chrough (f).
Sum of Two Dice
20-
10-
0-
4
6
10
12
8
Value of dice
(a) What was the most frequent outcome of the experiment?
(b) What as the least frequent?
2
(c) How many times did we observe a 5?
(1,1)
More
Click to select your answer(s).
acer
N EN O
Frequency
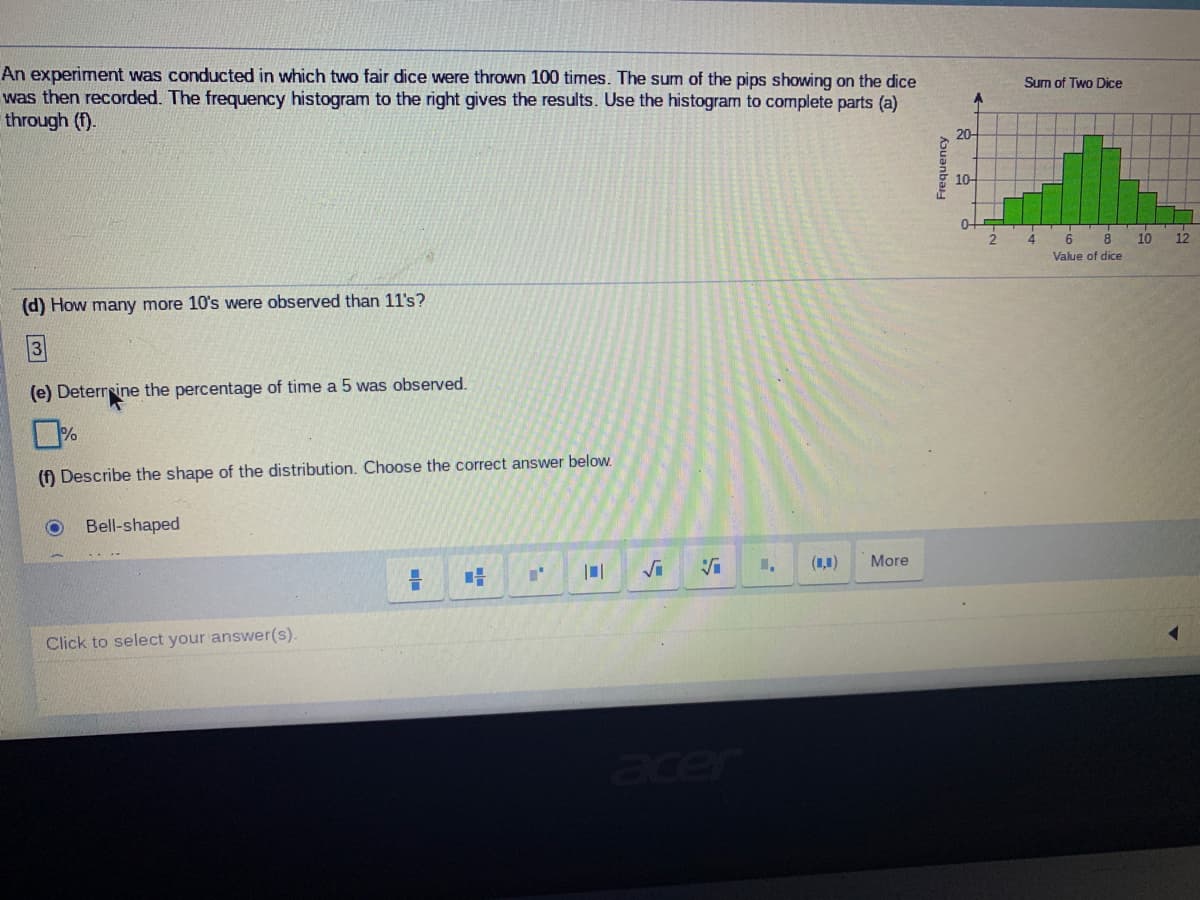
Transcribed Image Text:An experiment was conducted in which two fair dice were thrown 100 times. The sum of the pips showing on the dice
was then recorded. The frequency histogram to the right gives the results. Use the histogram to complete parts (a)
through (f).
Sum of Two Dice
20-
10-
4.
10
12
Value of dice
(d) How many more 10's were observed than 11's?
(e) Deterrsine the percentage of time a 5 was observed.
(f) Describe the shape of the distribution. Choose the correct answer below.
Bell-shaped
(1,1)
More
Click to select your answer(s).
acer
Frequency
Expert Solution
This question has been solved!
Explore an expertly crafted, step-by-step solution for a thorough understanding of key concepts.

This is a popular solution!

Trending now
This is a popular solution!

Step by step
Solved in 2 steps with 8 images

Knowledge Booster


Learn more about
Need a deep-dive on the concept behind this application? Look no further. Learn more about this topic, statistics and related others by exploring similar questions and additional content below.Recommended textbooks for you
Glencoe Algebra 1, Student Edition, 9780079039897…
Algebra
ISBN:
9780079039897
Author:
Carter
Publisher:
McGraw Hill

Holt Mcdougal Larson Pre-algebra: Student Edition…
Algebra
ISBN:
9780547587776
Author:
HOLT MCDOUGAL
Publisher:
HOLT MCDOUGAL

Algebra & Trigonometry with Analytic Geometry
Algebra
ISBN:
9781133382119
Author:
Swokowski
Publisher:
Cengage
Glencoe Algebra 1, Student Edition, 9780079039897…
Algebra
ISBN:
9780079039897
Author:
Carter
Publisher:
McGraw Hill
Holt Mcdougal Larson Pre-algebra: Student Edition…
Algebra
ISBN:
9780547587776
Author:
HOLT MCDOUGAL
Publisher:
HOLT MCDOUGAL
Algebra & Trigonometry with Analytic Geometry
Algebra
ISBN:
9781133382119
Author:
Swokowski
Publisher:
Cengage

College Algebra (MindTap Course List)
Algebra
ISBN:
9781305652231
Author:
R. David Gustafson, Jeff Hughes
Publisher:
Cengage Learning