(a) Which of the following is true regarding the Central Limit Theorem (CLT)? (i) If your sample size is n = 30 exactly, then you are guaranteed to have an approximately normal sampling distribution of the sample mean. (ii) As the sample size n increases, the data distribution should become approximately normal. (iii) The Central Limit Theorem states that the sampling distribution of the sample mean should always have the same shape as the population distribution. (iv) none of the above
(a) Which of the following is true regarding the Central Limit Theorem (CLT)? (i) If your sample size is n = 30 exactly, then you are guaranteed to have an approximately normal sampling distribution of the sample mean. (ii) As the sample size n increases, the data distribution should become approximately normal. (iii) The Central Limit Theorem states that the sampling distribution of the sample mean should always have the same shape as the population distribution. (iv) none of the above

MATLAB: An Introduction with Applications
6th Edition
ISBN:9781119256830
Author:Amos Gilat
Publisher:Amos Gilat
Chapter1: Starting With Matlab
Section: Chapter Questions
Problem 1P

Related questions
Question
Transcribed Image Text:7. [Multiple Choices}
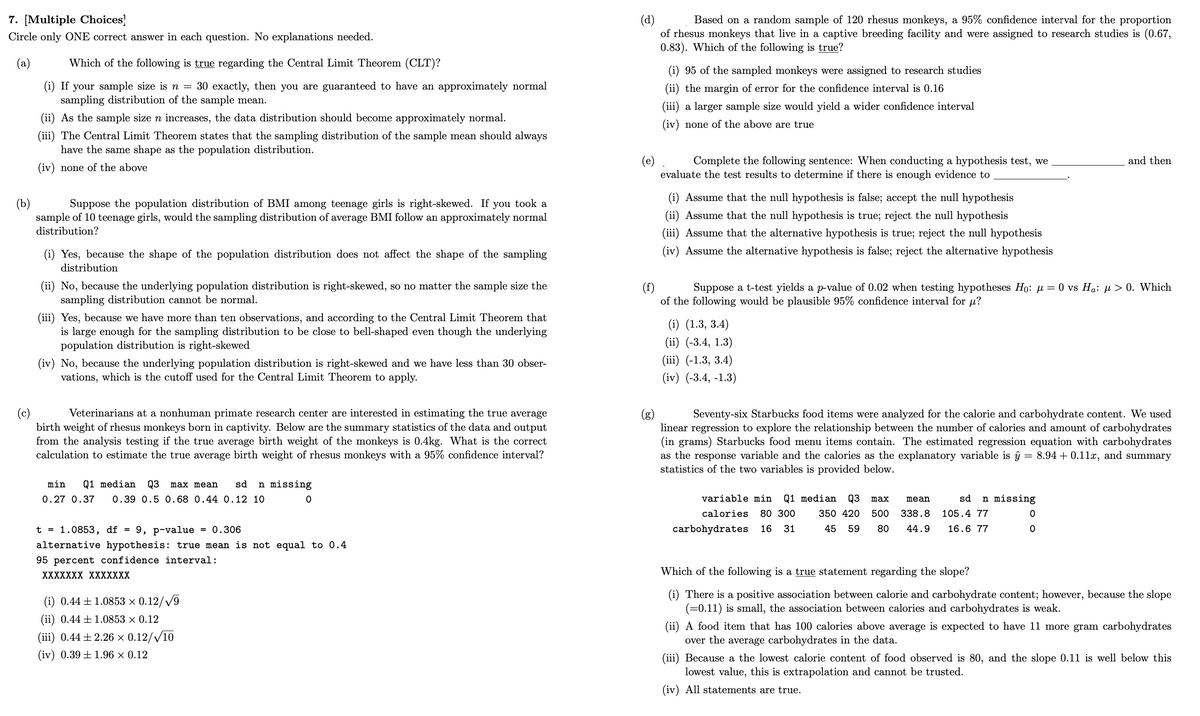
(d)
of rhesus monkeys that live in a captive breeding facility and were assigned to research studies is (0.67,
0.83). Which of the following is true?
Based on a random sample of 120 rhesus monkeys, a 95% confidence interval for the proportion
Circle only ONE correct answer in each question. No explanations needed.
(a)
Which of the following is true regarding the Central Limit Theorem (CLT)?
(i) 95 of the sampled monkeys were assigned to research studies
(i) If your sample size is n = 30 exactly, then you are guaranteed to have an approximately normal
sampling distribution of the sample mean.
(ii) the margin of error for the confidence interval is 0.16
(iii) a larger sample size would yield a wider confidence interval
(ii) As the sample size n increases, the data distribution should become approximately normal.
(iv) none of the above are true
(iii) The Central Limit Theorem states that the sampling distribution of the sample mean should always
have the same shape as the population distribution.
(e)
evaluate the test results to determine if there is enough evidence to
Complete the following sentence: When conducting a hypothesis test, we
and then
(iv) none of the above
(i) Assume that the null hypothesis is false; accept the null hypothesis
(b)
sample of 10 teenage girls, would the sampling distribution of average BMI follow an approximately normal
Suppose the population distribution of BMI among teenage girls is right-skewed. If you took a
(ii) Assume that the null hypothesis is true; reject the null hypothesis
distribution?
(iii) Assume that the alternative hypothesis is true; reject the null hypothesis
(i) Yes, because the shape of the population distribution does not affect the shape of the sampling
(iv) Assume the alternative hypothesis is false; reject the alternative hypothesis
distribution
(ii) No, because the underlying population distribution is right-skewed, so no matter the sample size the
sampling distribution cannot be normal.
(iii) Yes, because we have more than ten observations, and according to the Central Limit Theorem that
is large enough for the sampling distribution to be close to bell-shaped even though the underlying
population distribution is right-skewed
(f)
of the following would be plausible 95% confidence interval for u?
Suppose a t-test yields a p-value of 0.02 when testing hypotheses Ho: µ = 0 vs Ha: µ > 0. Which
(i) (1.3, 3.4)
(ii) (-3.4, 1.3)
(iї) (-1.3, 3.4)
(iv) No, because the underlying population distribution is right-skewed and we have less than 30 obser-
vations, which is the cutoff used for the Central Limit Theorem to apply.
(iv) (-3.4, -1.3)
(c)
birth weight of rhesus monkeys born in captivity. Below are the summary statistics of the data and output
from the analysis testing if the true average birth weight of the monkeys is 0.4kg. What is the correct
calculation to estimate the true average birth weight of rhesus monkeys with a 95% confidence interval?
Veterinarians at a nonhuman primate research center are interested in estimating the true average
(g)
linear regression to explore the relationship between the number of calories and amount of carbohydrates
(in grams) Starbucks food menu items contain. The estimated regression equation with carbohydrates
as the response variable and the calories as the explanatory variable is ŷ
statistics of the two variables is provided below.
Seventy-six Starbucks food items were analyzed for the calorie and carbohydrate content. We used
= 8.94 + 0.11x, and summary
min
Q1 median
Q3
max mean
sd
n missing
0.27 0.37
0.39 0.5 0.68 0.44 0.12 10
variable min
Q1 median Q3
sd
n missing
max
mean
calories
80 300
350 420
500
338.8
105.4 77
9, p-value = 0.306
alternative hypothesis: true mean is not equal to 0.4
t = 1.0853, df =
carbohydrates
16
31
45 59
80
44.9
16.6 77
95 percent confidence interval:
ХXXXXXX XXXX
Which of the following is a true statement regarding the slope?
(i) There is a positive association between calorie and carbohydrate content; however, because the slope
(=0.11) is small, the association between calories and carbohydrates is weak.
(i) 0.44 + 1.0853 × 0.12/V9
(ii) 0.44 ±1.0853 × 0.12
(ii) A food item that has 100 calories above average is expected to have 11 more gram carbohydrates
over the average carbohydrates in the data.
(iii) 0.44± 2.26 × 0.12//10
(iv) 0.39 ± 1.96 × 0.12
(iii) Because a the lowest calorie content of food observed is 80, and the slope 0.11 is well below this
lowest value, this is extrapolation and cannot be trusted.
(iv) All statements are true.
Expert Solution
This question has been solved!
Explore an expertly crafted, step-by-step solution for a thorough understanding of key concepts.

This is a popular solution!

Trending now
This is a popular solution!

Step by step
Solved in 2 steps

Recommended textbooks for you
MATLAB: An Introduction with Applications
Statistics
ISBN:
9781119256830
Author:
Amos Gilat
Publisher:
John Wiley & Sons Inc

Probability and Statistics for Engineering and th…
Statistics
ISBN:
9781305251809
Author:
Jay L. Devore
Publisher:
Cengage Learning

Statistics for The Behavioral Sciences (MindTap C…
Statistics
ISBN:
9781305504912
Author:
Frederick J Gravetter, Larry B. Wallnau
Publisher:
Cengage Learning
MATLAB: An Introduction with Applications
Statistics
ISBN:
9781119256830
Author:
Amos Gilat
Publisher:
John Wiley & Sons Inc
Probability and Statistics for Engineering and th…
Statistics
ISBN:
9781305251809
Author:
Jay L. Devore
Publisher:
Cengage Learning
Statistics for The Behavioral Sciences (MindTap C…
Statistics
ISBN:
9781305504912
Author:
Frederick J Gravetter, Larry B. Wallnau
Publisher:
Cengage Learning

Elementary Statistics: Picturing the World (7th E…
Statistics
ISBN:
9780134683416
Author:
Ron Larson, Betsy Farber
Publisher:
PEARSON

The Basic Practice of Statistics
Statistics
ISBN:
9781319042578
Author:
David S. Moore, William I. Notz, Michael A. Fligner
Publisher:
W. H. Freeman

Introduction to the Practice of Statistics
Statistics
ISBN:
9781319013387
Author:
David S. Moore, George P. McCabe, Bruce A. Craig
Publisher:
W. H. Freeman