(a) Which test would be more appropriate in this case: a t-test for the difference between two population means, or a paired t-test? Why? (b) Do the data provide sufficient evidence to support the claim that the mean PCB level has decreased in the region? Be sure to check all assumptions, write the null and alternative hypotheses, calculate the appropriate test statistic, calculate the p-value, and state your conclusion. (c) Construct a 95% confidence interval for the mean decrease in PCB level.


widely used as dielectrics and coolants in electrical systems in the past. They were found to be a major environmental contaminant in the 1960s. In a study, the
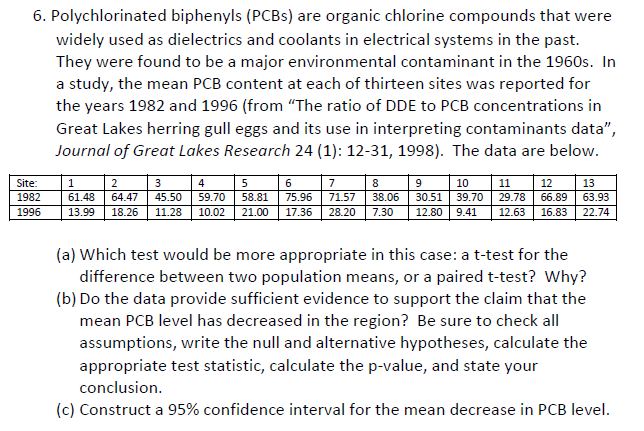
Site:
1
2
3
4
5
6
7
8
9
10
11
12
13
1982
61.48
64.47
45.50
59.70
58.81
75.96
71.57
38.06
30.51
39.70
29.78
66.89
63.93
1996
13.99
18.26
11.28
10.02
21.00
17.36
28.20
7.30
12.80
9.41
12.63
16.83
22.74
(a) Which test would be more appropriate in this case: a t-test for the difference between two population means, or a paired t-test? Why?
(b) Do the data provide sufficient evidence to support the claim that the mean PCB level has decreased in the region? Be sure to check all assumptions, write the null and alternative hypotheses, calculate the appropriate test statistic, calculate the p-value, and state your conclusion.
(c) Construct a 95% confidence interval for the mean decrease in PCB level.


Trending now
This is a popular solution!

Step by step
Solved in 4 steps


