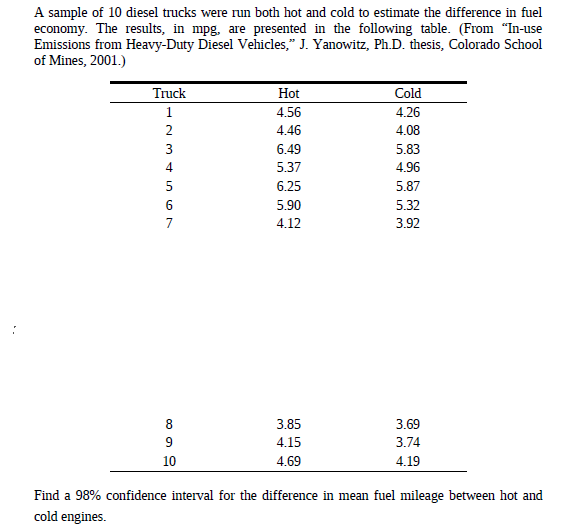
A sample of 10 diesel trucks were run both hot and cold to estimate the difference in fuel economy. The results, in mpg. are presented in the following table. (From "In-use Emissions from Heavy-Duty Diesel Vehicles," J. Yanowitz, Ph.D. thesis, Colorado School of Mines, 2001.) Truck Hot Cold 4.56 4.26 2 4.46 4.08 3 6.49 5.83 5.37 4.96 5 6.25 5.87 6 5.90 5.32 4.12 3.92 8 3.85 3.69 4.15 3.74 10 4.69 4.19 Find a 98% confidence interval for the difference in mean fuel mileage between hot and cold engines.


Q: The following results are from a dataset that measured the times to morbidity (in seconds) for three…
A: The result from a dataset that measured the times to morbidity (in second) for three genetic strains…
Q: Q1: The effect of three different lubricating oils on fuel economy in truck engines is being…
A: NOTE: As per the guidelines, we are supposed to solve first 3 sub parts only. Given: Different…
Q: Listed below, along with some summary statistics, are amounts of strontium-90 (in millibecquerels…
A: The data is collected from the same group of subjects consecutively for two years. Therefore both…
Q: A study measures the sorption rate of three different types of organic chemical solvents. These…
A: Given data : Aromatics chloroalkenes Esters 1.06 1.58 0.29 0.79 1.45 0.06 0.82 0.57 0.44…
Q: Listed below are measured amounts of greenhouse gas emissions from cars in three different…
A: State the hypotheses.
Q: An article in Journal of Food Science (2001, Vol. 66, No. 3, pp. 472-477) studied potato spoilage…
A:
Q: A researcher wanted to determine if carpeted rooms contain more bacteria than uncarpeted rooms. The…
A: The standard practice, while setting up the presumed hypothesis usually advocates for setting up the…
Q: Suppose a researcher wants to evaluate the effect of new diet on weight loss. He randomly selected…
A: To evaluate the effect of new diet on weight loss a researcher randomly selected the sample of n=5…
Q: In an experiment to determine the effect of ambient temperature on the emissions of oxides of…
A: The test is carried out using Excel software and the procedure is given below, Enter the data into…
Q: A study measures the sorption rate of three different types of organic chemical solvents. These…
A: Given :
Q: A researcher is interested in hamster wheel-running activity during the summer versus the winter. He…
A: The average difference score is MD = 3.8, the sum of squares is SS = 522.15 and the sample size is n…
Q: A paper gave summary quantities for blood lead level (in micrograms per deciliter) for a sample of…
A: Calculate the Sample mean using general formula.................................
Q: Much concern has been expressed regarding the practice of using nitrates as meat preservatives. In…
A: Denote μ as the population mean rate of uptake.
Q: The recommended daily dietary allowance for zino among males older than age 50 years is 15 mg/day.…
A: Given: n = 155, barx = 11.3, and s = 6.43
Q: A random sample of 130 recent donations at a certain blood bank reveals that 30 were type B blood.…
A: Here's, given that sample number is 130 and select 30. We will use one proportion z test.
Q: Much concern has been expressed regarding the practice of using nitrates as meat preservatives. In…
A: Given data is 7252,6872,9637,6864,9099,5841,8953,7975,7069,7499,7888,8175,7529,8729,7465sample…
Q: Much concern has been expressed regarding the practice of using nitrates as meat preservatives. In…
A:
Q: An athletic director suggests the median number for the paid attendance at 17 local football games…
A: The value of median is given to test the hypothesis we choose sign rank test. This can be used for…
Q: In an attempt to measure the effects of acid rain, researchers measured the pH (7 is neutral and…
A:
Q: John investigated the quantitative determination of Cr in high-alloy steels by a potentiometric…
A: The results for the analysis of a single reference steel is given. Let xi denote the sample…
Q: An article in Journal of Food Science [2001, Vol. 66(3), pp. 472-477] reported on a study of potato…
A: Given that By using excel single factor anova
Q: 2. To study the physical fitness for adult males in the 60-69 year age group, a sample of 28 people…
A: The given data set is: 60 62 62 65 65 65 68 70 72 75 75 76 79 80…
Q: A paper gave summary quantities for blood lead level (in micrograms per deciliter) for a sample of…
A: Note: As per our company guidelines, we are supposed to answer only the first question. Kindly…
Q: Household wastewater quality at Tabuan Jaya was compared during low, medium and high flow. Is there…
A: H0:μLow=μMedium=μHigh Vs H1: At least one of them is significantly different from others.
Q: Radiation in Baby Teeth Listed below are amounts of strontium-90 (in millibecquerels, or mBq) in a…
A: In this case we need to construct the boxplot for the amounts of strontium-90 and also identify the…
Q: Blood cocaine concentration (mg/L) was determinedboth for a sample of individuals who had died…
A: a.
Q: An article in Environment International (Vol. 18, No. 4, 1992) describes an experiment in which the…
A:
Q: An article reported data from a study in which both a baseline gasoline mixture and a reformulated…
A: Scatter plot: Excel Procedure: Enter the Age and Baseline in Excel>Select the Age and…
Q: In an attempt to measure the effects of acid rain, researchers measured the pH (7 is neutral and…
A: Five number summary,Box and Whisker Plots…
Q: The following data were taken from a research article in the Canadian Journal of Fisheries and…
A: 1. The null and alternative hypothesis is given by, H0:μ1-μ2=0Ha:μ1-μ2≠0 2. The sample for LSL is 10…
Q: A random sample of 15 individuals representing three different types of music has been observed for…
A: Since we only answer up to 3 sub-parts, we’ll answer the first 3. Please resubmit the question and…
Q: 11. Find out the likely production corresponding to a rainfall of 40 cms. from the following data:…
A: Regression equation : The equation is written as Y= a + bX, wherever Y is that the variable (the…
Q: rofessor Cornish studied rainfall cycles and sunspot cycles. (Reference: Australian Journal of…
A: (a). Compute the value of median for the given data: The data represents the rain amounts (X) for…
Q: A major corporation noted that last year its employees averaged - = 5.8 (o = 2.15) absences during…
A: "Since you have posted a question with multiple sub-parts, we will solve the first three sub-parts…
Q: Researchers interested in lead exposure due to car exhaust sampled the blood of 52 police officers…
A: Note, Since you have asked multiple question, we will solve the first question for you. If you want…
Q: Samples of plastic product were selected from a batch of material, and the tensile strength in kg…
A: The question is about one way ANOVA Given :
Q: In an experiment to determine the effect of ambient temperature on the emissons of oxides of…
A:
Q: We are testing whether a particular program of low impact exercise can improve the cholesterol level…
A: data is given
Q: Penicillin is produced by the Penicillium fungus, which is grown in a broth whose sugar content must…
A:
Q: An article in Journal of Food Science (2001. Vol. 66, No. 3. pp. 472-477) studied potato spoilage…
A: Given data: AO solution % spoilage % spoilage % spoilage 50 100 50 60 100 60 30 30 200 60…
Q: 2. Volcanologists have measured the hydrogen content (in % of total umber of atoms) of samples of…
A: Given,
Q: Department of Research and Development of Unilever Sdn Bhd has condi study to improve the quality of…
A: Given: n = 50
Q: Calculate the average values of the Cp and Cpk capabil-ity indices for the BOD data , assuming that…
A: The value cp and cpk is a well known capability indices value which used to understand the…
Q: In an attempt to measure the effects of acid rain, researchers measured the pH (7 is neutral and…
A: Quartiles and median: Q1=4.335, from the excel function, =QUARTILE(E2:E41,1) Q3=5.1125, from the…
Q: Which of the following is consistent with what r represents as a measure of effect size? the portion…
A: 11) In this case, we need to find the correct option for the given statament.
Q: The Board of Transportation and Safety (BTS) wants to examine the safety mechanisms of A, B, and…
A: Test Hypotheses: There are 3 types of cars. Denote the true average of the three types of cars A, B…
Q: Members of the millennial generation are continuing to be dependent on their parents (either living…
A: H0 : p ≤0.3 H1 : p >0.3 Population proportion = p₀ = 0.3 Sample number of events = x…
Q: A group of six, obese adult men had their weights recorded both before and 10 months after having a…
A: Number of obese people (n) = 0.05 Given weights before and after treatment are
Q: Analysis of several plant-food preparations for potassium ion yielded the following data: Sample…
A: b. Use the DEVSQ( ) function to find the sum of squares of the deviations for each sample, then the…


Trending now
This is a popular solution!

Step by step
Solved in 3 steps with 3 images

- Suppose an experiment finds that people taking a new herbal remedy get fewer colds than people taking a placebo. The results are statistically significant at the 0.01 level. Has the experiment proven that the herbal remedy works?In a study of 420,148 cell phone users, 136 subjects developed cancer of the brain or nervous system. Test the claim of a somewhat common belief that such cancers are affected by cell phone use. That is, test the claim that cell phone users develop cancer of the brain or nervous system at a rate that is different from the rate of 0.0340% for people who do not use cell phones. Because this issue has such great importance, use a 0.005significance level. Identify the null hypothesis, alternative hypothesis, test statistic, P-value, conclusion about the null hypothesis, and final conclusion that addresses the original claim. Use the P-value method and the normal distribution as an approximation to the binomial distribution. 1. What is the test statistic? z= _____ (Round to two decimal places as needed.) 2. What is the P-value? P-value= _____ (Round to four decimal places as needed.) 3. What is the conclusion on the null hypothesis?…Rosner analyzed data from children who lived near a lead smelter (which is a facility that uses extreme heat to extract the metal lead from lead ore) in El Paso, Texas, and reported that out of 124 children studied, 23 developed colic (which is a pattern of fussiness and crying for no apparent reason). Suppose that in the state of Taxes in general at the time (early 1980s), the rate of colic in children was 16.0%. Follow the steps for testing whether the proportion of children developing clico was significantly different for the 124 children living near the lead smelter than for Taxes children in general (16%). Use alpha level of 0.03 a. Identify the null hypothesis for this statistical test. b. Identify the alternative hypotheses for this statistical test. c. Explain: Why should this be a two-tailed test, the way I have described it? d. calculate the sample proportion p̂, rounded to three decimal places. e. Calculate the appropriate test statistic, show all work. f. Based on…
- The following summary table presents the results from an ANOVA comparing four treatment conditions with n=10 participants in each condition. Complete all missing values. Source SS df MS Between Treatments 10 F= Within Treatments Total 174A manufacturer of flashlight batteries claims that the average life of her batteries is larger than 400 hours. Peter, as a quality assurance officer in the manufacturing company, took a random sample of 13 batteries from a day’s production and used them continuously until they failed to work. The lifetime (hours) until failure was:342 426 317 545 264 451 1049 631 512 266 492 562 298 (a) At the 0.05 level of significance, is there evidence that the manufacturer’s claim is correct? (b) What is the p-value?The human resources director of a large company recently asked her staff to conduct a study of the airline miles traveled by executives of the company during the most recent calendar year. The analyst assigned to the project randomly sampled 25 male executives and 25 female executives. Of particular interest to the HR director is whether males have greater variability in miles flown than females. The statistics available below were computed from the samples. Based on these data, what should the HR director conclude if an alpha level equal to 0.01 is used? LOADING... Click the icon to view the statistics about the number of miles flown. Males Females Mean Miles 73,262 66,888 St. Deviation Miles 2,568 1,539 Sample Size 25 25 Let sample 1 be males and sample 2 be females. What are the null and alternative hypotheses? A. H0: σ21=σ22 HA: σ21≠σ22 B. H0: σ21≤σ22 HA: σ21>σ22 C. H0: σ21≥σ22 HA:…
- The article “Improved Bioequivalence Assessment of Topical Dermatological Drug Products Using Dermatopharmacokinetics” (B. N’Dri-Stempfer, W. Navidi, et al., Pharmaceutical Research, 2009:316–328) describes a study in which a new type of ointment was applied to forearms of volunteers to study the rates of absorption into the skin. Eight locations on the forearm were designated for ointment application. The new ointment was applied to four locations, and a control was applied to the other four. How many different choices were there for the four locations to apply the new ointment?A company surveyed adult Americans about their consumer debt. The article reported that 48% of millennials (those born between 1980 and 1996) and 62% of Gen Xers (those born between 1965 and 1971) did not pay off their credit cards each month, and therefore carried a balance from month to month. Suppose that these percentages were based on representative samples of 450 millennials and 300 Gen Xers. Is there convincing evidence that the proportion of Gen Xers who do not pay off their credit cards each month is greater than this proportion for millennials? Test the appropriate hypotheses using a significance level of 0.05. (Let p1 be the proportion of Gen Xers who do not pay off their credit cards each month, and p2 be the proportion of Millennials who do not pay off their credit cards each month.) State the appropriate null and alternative hypotheses. H0: p1 − p2 = 0 Ha: p1 − p2 ≠ 0 H0: p1 − p2 > 0 Ha: p1 − p2 < 0 H0: p1 − p2 < 0 Ha: p1 − p2 > 0 H0: p1 − p2 = 0…A company surveyed adult Americans about their consumer debt. The article reported that 48% of millennials (those born between 1980 and 1996) and 62% of Gen Xers (those born between 1965 and 1971) did not pay off their credit cards each month, and therefore carried a balance from month to month. Suppose that these percentages were based on representative samples of 450 millennials and 300 Gen Xers. Is there convincing evidence that the proportion of Gen Xers who do not pay off their credit cards each month is greater than this proportion for millennials? Test the appropriate hypotheses using a significance level of 0.05. (Let p1 be the proportion of Gen Xers who do not pay off their credit cards each month, and p2 be the proportion of Millennials who do not pay off their credit cards each month.) State the appropriate null and alternative hypotheses. H0: p1 − p2 = 0 Ha: p1 − p2 > 0 H0: p1 − p2 = 0 Ha: p1 − p2 < 0 H0: p1 − p2 > 0 Ha: p1 − p2 < 0 H0: p1 − p2 <…