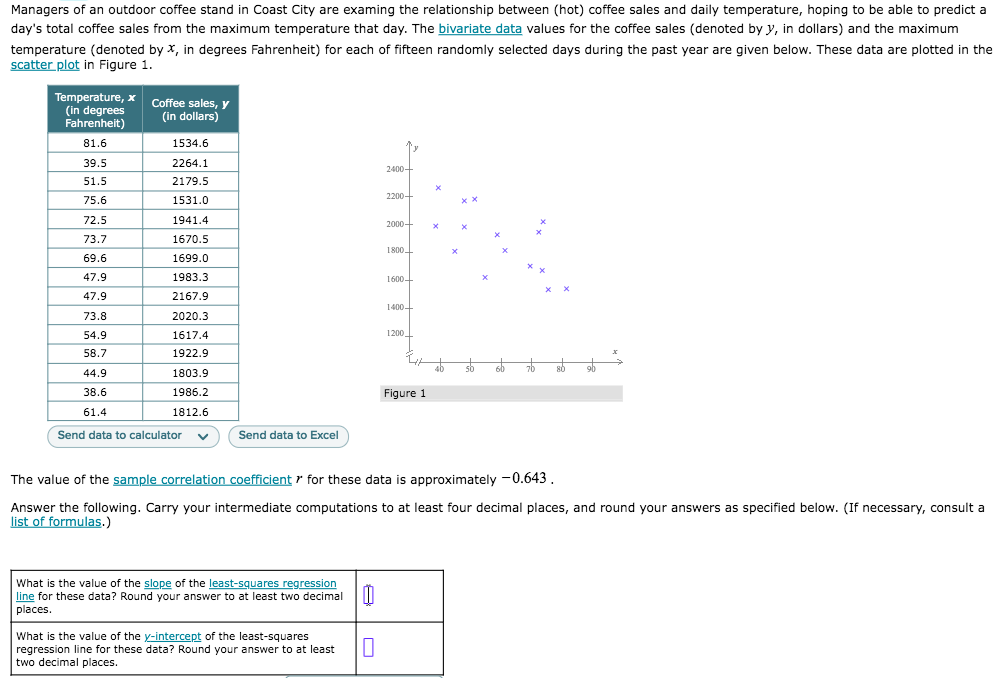
Managers of an outdoor coffee stand in Coast City are examing the relationship between (hot) coffee sales and daily temperature, hoping to be able to predict a day's total coffee sales from the maximum temperature that day. The bivariate data values for the coffee sales (denoted by y, in dollars) and the maximum temperature (denoted by x, in degrees Fahrenheit) for each of fifteen randomly selected days during the past year are given below. These data are plotted in the scatter plot in Figure 1. Temperature, x (in degrees Fahrenheit) Coffee sales, y (in dollars) 81.6 1534.6 39.5 2264.1 2400+ 51.5 2179.5 2200- 75.6 1531.0 72.5 1941.4 2000- 73.7 1670.5 1800. 69.6 1699.0 47.9 1983.3 1600- 47.9 2167.9 1400- 73.8 2020.3 54.9 1617.4 1200 58.7 1922.9 44.9 1803.9 38.6 1986.2 Figure 1 61.4 1812.6 Send data to calculator Send data to Excel The value of the sample correlation coefficient r for these data is approximately -0.643. Answer the following. Carry your intermediate computations to at least four decimal places, and round your answers as specified below. (If necessary, consult a list of formulas.) What is the value of the slope of the least-squares regression line for these data? Round your answer to at least two decimal II places. What is the value of the y-intercept of the least-squares regression line for these data? Round your answer to at least two decimal places.
Managers of an outdoor coffee stand in Coast City are examing the relationship between (hot) coffee sales and daily temperature, hoping to be able to predict a day's total coffee sales from the maximum temperature that day. The bivariate data values for the coffee sales (denoted by y, in dollars) and the maximum temperature (denoted by x, in degrees Fahrenheit) for each of fifteen randomly selected days during the past year are given below. These data are plotted in the scatter plot in Figure 1. Temperature, x (in degrees Fahrenheit) Coffee sales, y (in dollars) 81.6 1534.6 39.5 2264.1 2400+ 51.5 2179.5 2200- 75.6 1531.0 72.5 1941.4 2000- 73.7 1670.5 1800. 69.6 1699.0 47.9 1983.3 1600- 47.9 2167.9 1400- 73.8 2020.3 54.9 1617.4 1200 58.7 1922.9 44.9 1803.9 38.6 1986.2 Figure 1 61.4 1812.6 Send data to calculator Send data to Excel The value of the sample correlation coefficient r for these data is approximately -0.643. Answer the following. Carry your intermediate computations to at least four decimal places, and round your answers as specified below. (If necessary, consult a list of formulas.) What is the value of the slope of the least-squares regression line for these data? Round your answer to at least two decimal II places. What is the value of the y-intercept of the least-squares regression line for these data? Round your answer to at least two decimal places.

Linear Algebra: A Modern Introduction
4th Edition
ISBN:9781285463247
Author:David Poole
Publisher:David Poole
Chapter7: Distance And Approximation
Section7.3: Least Squares Approximation
Problem 31EQ

Related questions
Question
Transcribed Image Text:Managers of an outdoor coffee stand in Coast City are examing the relationship between (hot) coffee sales and daily temperature, hoping to be able to predict a
day's total coffee sales from the maximum temperature that day. The bivariate data values for the coffee sales (denoted by y, in dollars) and the maximum
temperature (denoted by x, in degrees Fahrenheit) for each of fifteen randomly selected days during the past year are given below. These data are plotted in the
scatter plot in Figure 1.
Temperature, x
(in degrees
Fahrenheit)
Coffee sales, y
(in dollars)
81.6
1534.6
39.5
2264.1
2400+
51.5
2179.5
2200-
75.6
1531.0
72.5
1941.4
2000-
73.7
1670.5
1800.
69.6
1699.0
47.9
1983.3
1600-
47.9
2167.9
1400-
73.8
2020.3
54.9
1617.4
1200
58.7
1922.9
44.9
1803.9
38.6
1986.2
Figure 1
61.4
1812.6
Send data to calculator
Send data to Excel
The value of the sample correlation coefficient r for these data is approximately -0.643.
Answer the following. Carry your intermediate computations to at least four decimal places, and round your answers as specified below. (If necessary, consult a
list of formulas.)
What is the value of the slope of the least-squares regression
line for these data? Round your answer to at least two decimal II
places.
What is the value of the y-intercept of the least-squares
regression line for these data? Round your answer to at least
two decimal places.
Expert Solution
This question has been solved!
Explore an expertly crafted, step-by-step solution for a thorough understanding of key concepts.

This is a popular solution!

Trending now
This is a popular solution!

Step by step
Solved in 2 steps with 2 images

Recommended textbooks for you
Linear Algebra: A Modern Introduction
Algebra
ISBN:
9781285463247
Author:
David Poole
Publisher:
Cengage Learning

Glencoe Algebra 1, Student Edition, 9780079039897…
Algebra
ISBN:
9780079039897
Author:
Carter
Publisher:
McGraw Hill
Linear Algebra: A Modern Introduction
Algebra
ISBN:
9781285463247
Author:
David Poole
Publisher:
Cengage Learning
Glencoe Algebra 1, Student Edition, 9780079039897…
Algebra
ISBN:
9780079039897
Author:
Carter
Publisher:
McGraw Hill