12.6 Test the hypothesis that there is an overall mean difference in bronchial reactivity among the three lung-function groups.
Q: A researcher uncovers that there is a significant interaction between the factor of marital status…
A:
Q: Tardigrades, or water bears, are a type of micro-animal famous for their resilience. In examining…
A: Given Information: Hypothesized value of population mean μ0=1150 Sample size n=25 Sample mean…
Q: In clinical tests of the drug Lipitor (generic name, atorvastatin) 863 patients were treated with 10…
A: Given that n=863 , X=19 , p=1.9%=0.019
Q: In one study of smokers who tried to quit smoking with nicotine path therapy, 41 were smoking…
A: a. It is needed to test the claim that whether the proportion of smokers who try to quit with…
Q: The article “Well-Fed Crickets Bowl Maidens Over” (Nature Science Update, February 11, 1999)…
A: Given data : sample size, n = 22 sample mean, x̄ = 65.32 sample standard…
Q: A sample of 10 diesel trucks were run both hot and cold to estimate the difference in fuel economy.…
A:
Q: A taxi company has been using Brand A tires, and the distribution of kilometers to wear-out has been…
A:
Q: A survey of 28 employed workers found that the correlation coefficient between the number of years…
A: Solution: a. State the hypotheses. Null hypothesis: That is, there is no relationship between…
Q: Patients immobilized for a substantial amount of time can de flop deep vein thrombosis (DVT), a…
A: We know that the (1-α)% confidence interval for the odds ratio is given by; elog(OR)±zα2×SE(log(OR))…
Q: HIV/AIDS patients are regularly monitored for their CD4 counts in order to make sure that…
A: GivenThe distribution of CD4 counts in population are normal distributedMean μ=237Standard deviation…
Q: Twenty-two young asthmatic volunteers were studied to assess the short-term effects of sulfur…
A: 12.6) Hypotheses for the test is given below: Null hypothesis: H0:μ1=μ2=μ3 Alternative hypothesis:…
Q: A random sample selected from a normal population with mean variance o2 gave the values 25, 31, 23,…
A:
Q: Elissa Epel, a professor of health psychology at the University of California-San Francisco, studied…
A:
Q: Listed below are numbers of enrolled students (in thousands) and number of campus burglaries from a…
A: The data is given as: Enrollment 32 31 53 28 27 66 42 30 34 65 Burglaries 94 83 86 47…
Q: A Researcher Studying The Relationship Between Maternal Age And Length Of Breastfeeding In A Sample…
A: Given Information: Sample Size (N)=75 Correlation r=0.19α=0.05
Q: Researchers recruited a sample of 40 female and 40 male heterosexual Caucasian undergraduate…
A: The sample size is 40, population mean is 18.5, sample mean is 18.85, and sample standard deviation…
Q: A random sample of 40 companies with assets over $10 million was surveyed and asked to indicate…
A: Solution: Given information: k= 3 groups n1= 10 Sample size of education n2= 14 Sample size of tax…
Q: The 5-year survival rates by stage of disease, age at diagnosis, and race are provided in Table…
A: Survival rate is the percentage of people who survived after diagnosing. So survival rate is a…
Q: A new material is being tested for use in the manufacture of electrical conduit, to determine…
A: Here, the crushing strengths are measured for a sample of size 16 of the old material and a sample…
Q: The article “Dynamics of Insulin Action in Hypertension: Assessment from Minimal ModelInterpretation…
A:
Q: Twenty-two young asthmatic volunteers were studied to assess the short-term effects of sulfur…
A: Twenty-two young asthmatic volunteers were studied to assess the short-term effects of sulphur…
Q: Two different research teams attempt to develop paint mixtures with more durability than the current…
A: We want to find F value
Q: The table to the right shows the cost per ounce (in dollars) for a random sample of toothpastes…
A: (a) Let μ1,μ2,μ3 be the population mean costs per ounce of toothpastes exhibiting very good stain…
Q: A random sample of 40 companies with assets over $10 million was surveyed and asked to indicate…
A: Solution Based on the comparison between the mean computer technology expense for companies in the…
Q: For a 3 sigma control chart of the process mean, the expected ARL when the process is currently in…
A: Given: For 3 sigma control chart of the process mean the expected ARL when the process is currently…
Q: Is there a significant difference between the average HDL levels of normal and obese adults?
A: It is given that For Normal, sample size n1 = 14, sample mean = 45, sample SD s1 = 10.1 For Obese,…
Q: A milk processing company test implemented a plant-wide energy conservation program with a goal of…
A: if we have two independent samples from two normal distribution with unequal variances σX2≠σY2,…
Q: Are these data good evidence that on average the E. coli levels in these swimming areas were safe?…
A: Using r software: use mean function in R to get mean x sd function in R to get standard deviation…
Q: A dlinical trial is conducted comparing a new pair reliever for arthritis to a placebo. Participants…
A:
Q: Twenty-two young asthmatic volunteers were studied to assess the short-term effects of sulfur…
A: Group A Group B Group C 20.8 7.5 9.2 4.1 7.5 2 30 11.9 2.5 24.7 4.5 6.1 13.8 3.1 7.5…
Q: When comparing the mean annual computer technology expenses for companies in the tax services and…
A: from given data we have; n=30, Tax Services n1=14, Education n2=10 no. of treatments k=3…
Q: A research study conducts a one-tailed test with an alpha level or significance value of 10% and a…
A: Given Information: Test conducted: One-tailed test. Significance level: 10% or 0.1 Sample size (n):…
Q: 4. A. What is the critical t-score for a two-tailed test with a a = 0.05? tcrit B. Is this…
A: Correlation coefficient r = 0.3931 The test statistic is given by
Q: Researchers at a medical school want to compare the rates of birth defects in babies born to mothers…
A: Given a research scenario, we have to write the research is experimental study or observational…
Q: A study is performed to examine the relationship between the concentration of plasma antioxidant…
A: Given Data
Q: When investigating the relationship between aerobic exercise capacity (as measured by VO2max, a…
A: To determine whether the correlation coefficient is significant : First compare the p-value to…
Q: In building an arena, steel bars with mean ultimate tensile strength of 400 megapascal(Mpa) with a…
A: It is given that the mean and standard deviation of the population is 400 MPa and 81 MPa,…
Q: Suppose a researcher is interested in the effectiveness in a new childhood exercise program…
A: INTRODUCTION : test for testing significance difference between two population mean Let x1, x2,…
Q: The measure of relationship between two variables is Mean Median Kurtosis Correlation
A: The measure of relationships between two variables is correlation So correct option is correlation.
Q: Tardigrades, or water bears, are a type af micro-animal famous for their resillience. In examining…
A: We want test the hypothesis
Q: Negligible Stress Minimal Moderate Severe Stress Stress Stress 1 3 3 2 1 3 4 1 3 4 1 1 4 3 3.25 0.50…
A:
Q: A researcher developed a regression model to predict the tear rating of a bag of coffee based on the…
A:
Q: Seedlings of understory trees in mature tropical rainforests must survive and grow using inter-…
A: i) Excel Procedure: Enter Mean fleck duration and Relative growth rate data in Excel Go to Data…
Q: wenty-two young asthmatic volunteers were studied to assess the short-term effects of sulfur dioxide…
A: Twenty-two young asthmatic volunteers were studied to assess the short-term effects of sulphur…
Q: Twenty-two young asthmatic volunteers were studied to assess the short-term effects of sulfur…
A: Given Information : Twenty-two young asthmatic volunteers were studied to assess the short-term…
Q: The article “Well-Fed Crickets Bowl Maidens Over” (Nature Science Update, February 11, 1999)…
A: Given data : sample size, n = 22 sample mean, x̄ = 65.32 sample standard…
Q: A sample of 12 men was used in a study to test the effects of a relaxant on the time required to…
A: Here we use Wilcoxon signed rank test. a. The null and alternative hypothesis is, H0:Medin time…
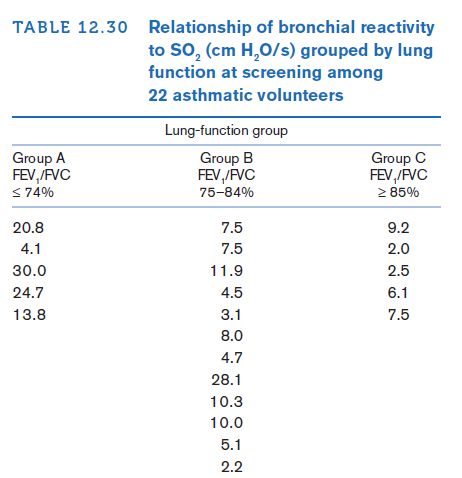
Twenty-two young asthmatic volunteers were studied to assess the short-term effects of sulfur dioxide (SO2) exposure under various conditions [12]. The baseline data in Table 12.30 were presented regarding bronchial reactivity to SO2 stratified by lung
12.6 Test the hypothesis that there is an overall mean difference in bronchial reactivity among the three lung-function groups.
12.7 Compare the means of each pair of groups using the LSD method.
12.8 Compare the means of each pair of groups using the Bonferroni method.
Trending now
This is a popular solution!
Step by step
Solved in 4 steps
- In Table 11.2 the estimated coefficient on black is 0.084 in column (1),0.688 in column (2), and 0.389 in column (3). In spite of these large differences, all three models yield similar estimates of the marginal effect of race on the probability of mortgage denial. How can this be?A group of six, obese adult men had their weights recorded both before and 10 months after having a diet treatment to help manage their weight. Observe the information presented in the table below: The weights of six obese adult men both before and 10-months after having a diet treatment Before Diet Treatment After Diet Treatment 250 240 225 215 220 198 311 300 326 298 205 205 Test at α = 0.05 the hypothesis that for the group, there was a statistically significant average decrease in weight from before diet treatment to 10 months after. Hint: This is hypothesis testing for paired samples. Here, you will use a paired t test.Recent publications have addressed the growing concern in the scientific community around the increased prevalence of CAT scans in children between the ages of 7-18 and the growing rate of childhood cancers. Suppose the researcher plans to gather a SRS from a group of children in this age range who have received one or more CAT scans, and a SRS from a group of children who have never received a CAT scan and compare the number of cases of childhood cancers that develop over a prolonged period of time. Assume the following table summarizes the descriptive statistics for his samples. Population Average cases of childhood cancers Standard deviaton Sample size >CAT scan 24.6 2.4 1,894 No CAT scans 11.4 1.9 2,745 A) Carry out the appropriate statistical test to answer the researcher’s hypothesis regarding the difference in average cases of childhood cancers in children aged 7-18 receiving one or more CAT scans versus those that have never received a CAT scan. Use an alpha level…
- A study carried out to investigate the distribution of totalbraking time (reaction time plus accelerator-to-brake movementtime, in ms) during real driving conditions at 60 km/hr gave the following summary information on the distributionof times (“A Field Study on Braking ResponsesDuring Driving,” Ergonomics, 1995: 1903–1910):mean 5 535 median 5 500 mode 5 500sd 5 96 minimum 5 220 maximum 5 9255th percentile 5 400 10th percentile 5 43090th percentile 5 640 95th percentile 5 720What can you conclude about the shape of a histogramof this data? Explain your reasoning.A researcher conducts a two-year study comparing the number of cavities in a group of 30 randomly selected young children from the community before and after the application of fluoride to test if there is a decrease in the number of cavities. This is an example of a/an: Independent-samples t test or Dependent-samples t test?To evaluate the coagulation effects of three drugs, 30 healthy volunteers were randomly assigned into 3 groups and injected with different drugs. Their relevant coagulation times were measured as follows A(group=1): 36.8 34.4 34.3 35.7 33.2 31.1 34.3 29.8 35.4 31.2B(group=2): 40.0 35.5 36.7 39.3 40.1 36.8 33.4 38.3 38.4 39.8C(group=3): 32.9 37.9 30.5 31.1 34.7 37.6 40.2 38.1 32.4 35.6Questions: ① If you want to evaluate whether the coagulation effects of the three drugs are different, which method should be used? and what are the model assumptionsfor the application of this method?② Compare the difference of the coagulation effects among three drugs by SPSS,present the main results and make interpretation.③ Make pairwise comparisons of the efficacy of the three drugs, write out the method of pairwise comparison you adopted (just write one method) and the corresponding p-values.