(a) Write the hypotheses for testing for a difference between the average number of hours spent on child care across educational attainment levels. (b) What is the conclusion of the hypothesis test?
(a) Write the hypotheses for testing for a difference between the average number of hours spent on child care across educational attainment levels. (b) What is the conclusion of the hypothesis test?

Glencoe Algebra 1, Student Edition, 9780079039897, 0079039898, 2018
18th Edition
ISBN:9780079039897
Author:Carter
Publisher:Carter
Chapter4: Equations Of Linear Functions
Section: Chapter Questions
Problem 8SGR

Related questions

Concept explainers
Power Operation
Power operation is topic of algebra in Math. It is use to represent repeated multiplication. Very big number and very small number can be easily express using power operation. Power operation is useful in many fields. In space engineering, it helps in representing the distance or size of particular heavenly body. In medical field, it is used to represent very small size. In medical field it helps to mention size of bacteria or virus.
Exponents
The exponent or power or index of a variable/number is the number of times that variable/number is multiplied by itself.
Question
100%
pls see attached
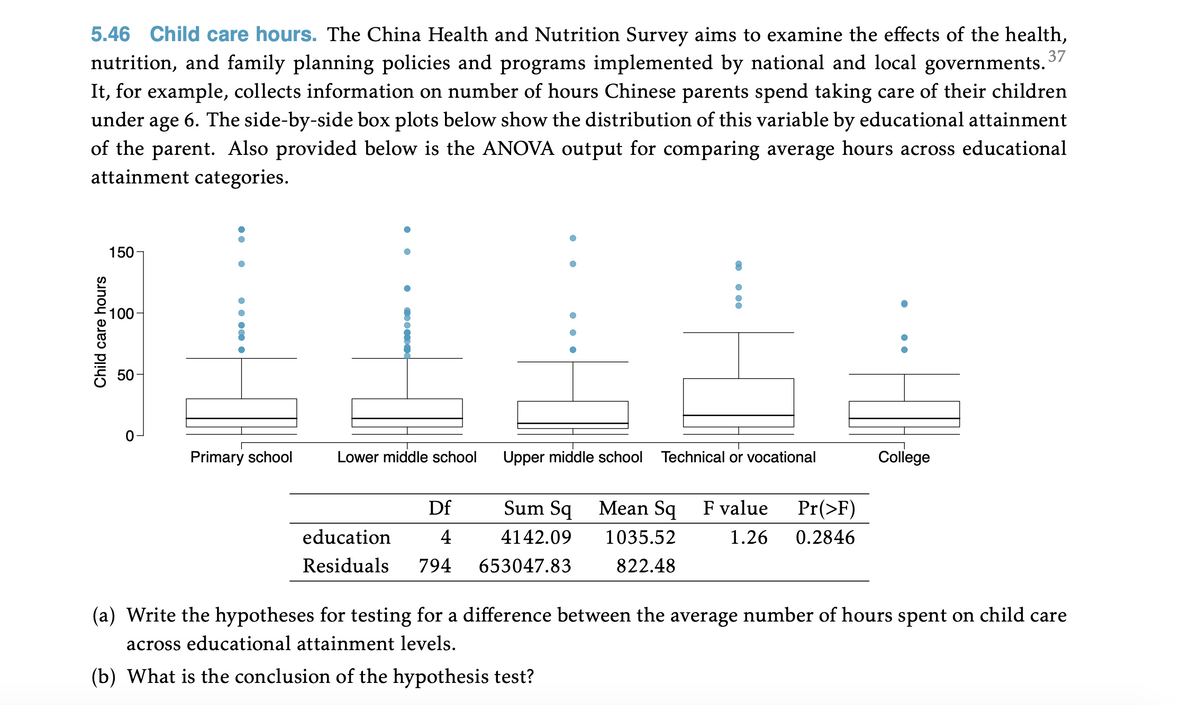
Transcribed Image Text:5.46 Child care hours. The China Health and Nutrition Survey aims to examine the effects of the health,
nutrition, and family planning policies and programs implemented by national and local governments.
It, for example, collects information on number of hours Chinese parents spend taking care of their children
under
age 6. The side-by-side box plots below show the distribution of this variable by educational attainment
of the parent. Also provided below is the ANOVA output for comparing average hours across educational
attainment categories.
150-
100-
Primary school
Lower middle school
Upper middle school Technical or vocational
College
Df
Sum Sq
Mean Sq
F value
Pr(>F)
education
4
4142.09
1035.52
1.26
0.2846
Residuals
794
653047.83
822.48
(a) Write the hypotheses for testing for a difference between the average number of hours spent on child care
across educational attainment levels.
(b) What is the conclusion of the hypothesis test?
Child care hours
Expert Solution
This question has been solved!
Explore an expertly crafted, step-by-step solution for a thorough understanding of key concepts.

This is a popular solution!

Trending now
This is a popular solution!

Step by step
Solved in 2 steps with 2 images

Knowledge Booster


Learn more about
Need a deep-dive on the concept behind this application? Look no further. Learn more about this topic, statistics and related others by exploring similar questions and additional content below.Recommended textbooks for you
Glencoe Algebra 1, Student Edition, 9780079039897…
Algebra
ISBN:
9780079039897
Author:
Carter
Publisher:
McGraw Hill
Glencoe Algebra 1, Student Edition, 9780079039897…
Algebra
ISBN:
9780079039897
Author:
Carter
Publisher:
McGraw Hill