1. Describe the difference between the null hypothesis and the research hypothesis of a study. Describe the difference between directional and nondirectional research hypotheses and describe how the corresponding null hypotheses are different.
1. Describe the difference between the null hypothesis and the research hypothesis of a study. Describe the difference between directional and nondirectional research hypotheses and describe how the corresponding null hypotheses are different.

MATLAB: An Introduction with Applications
6th Edition
ISBN:9781119256830
Author:Amos Gilat
Publisher:Amos Gilat
Chapter1: Starting With Matlab
Section: Chapter Questions
Problem 1P

Related questions

Question
Transcribed Image Text:Problems
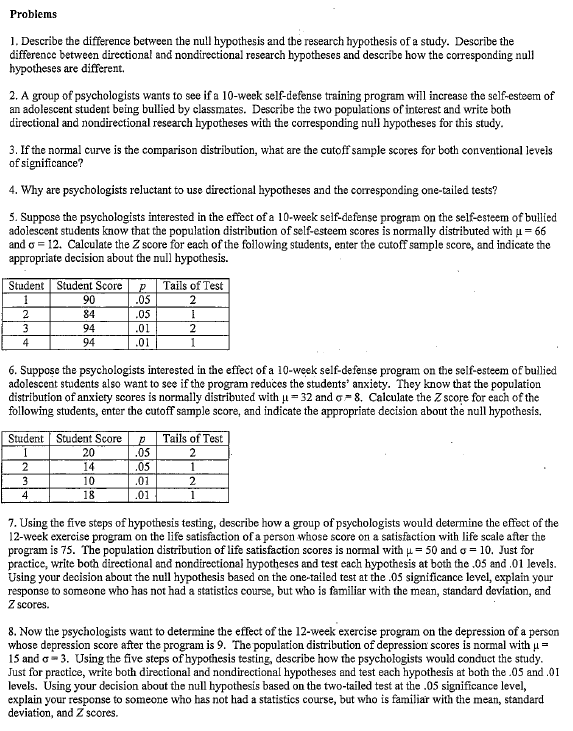
1. Describe the difference between the null hypothesis and the research hypothesis of a study. Describe the
difference between directional and nondirectional research hypotheses and describe how the corresponding null
hypotheses are different,
2. A group of psychologists wants to see if a 10-week self-defense training program will increase the self-esteem of
an adolescent student being bullied by classmates. Describe the two populations of interest and write both
directional and nondirectional research hypotheses with the corresponding null hypotheses for this study.
3. If the normal curve is the comparison distribution, what are the cutoff sample scores for both conventional levels
of significance?
4. Why are psychologists reluctant to use directional hypotheses and the corresponding one-tailed tests?
5. Suppose the psychologists interested in the effect of a 10-week self-defense program on the self-esteem of bullied
adolescent students know that the population distribution of self-esteem scores is r
and o = 12. Calculate the Z score for each of the following students, enter the cutoff sample score, and indicate the
appropriate decision about the null hypothesis.
y distributed with u = 66
Student Student Score
Tails of Test
90
.05
2
84
.05
3
94
.01
4
94
.01
1
6. Suppose the psychologists interested in the effect of a 10-week self-defense program on the self-esteem of bullied
adolescent students also want to sce if the program reduces the students" anxiety. They know that the population
distribution of anxiety scores is normally distributed with u= 32 and o= 8. Calculate the Z score for each of the
following students, enter the cutoff sample score, and indicate the appropriate decision about the null hypothesis.
Tails of Test
Student Student Score
20
.05
2.
14
.05
1
3
10
.01
2
4
18
.01
1
7. Using the five steps of hypothesis testing, describe how a group of psychologists would determine the effect of the
12-week exercise program on the life satisfaction of a person whose score on a satisfaction with life scale after the
program is 75. The population distribution of life satisfaction scores is normal with u = 50 and o = 10. Just for
practice, write both directional and nondirectional hypotheses and test each hypothesis at both the .05 and .01 levels.
Using your decision about the null hypothesis based on the one-tailed test at the .05 significance level, explain your
response to someone who has not had a statistics course, but who is familiar with the mean, standard deviation, and
Z scores.
8. Now the psychologists want to determine the effect of the 12-week exercise program on the depression of a person
whose depression score after the program is 9. The population distribution of depression scores is normal with u=
15 and o- 3. Using the five steps of hypothesis testing, describe how the psychologists would conduct the study.
Just for practice, write both directional and nondirectional hypotheses and test each hypothesis at both the .05 and .0I
levels. Using your decision about the null hypothesis based on the two-tailed test at the .05 significance level,
explain your response to someone who has not had a statistics course, but who is familiar with the mean, standard
deviation, and Z scores.
Expert Solution
This question has been solved!
Explore an expertly crafted, step-by-step solution for a thorough understanding of key concepts.

This is a popular solution!

Trending now
This is a popular solution!

Step by step
Solved in 2 steps

Knowledge Booster


Learn more about
Need a deep-dive on the concept behind this application? Look no further. Learn more about this topic, statistics and related others by exploring similar questions and additional content below.Recommended textbooks for you
MATLAB: An Introduction with Applications
Statistics
ISBN:
9781119256830
Author:
Amos Gilat
Publisher:
John Wiley & Sons Inc

Probability and Statistics for Engineering and th…
Statistics
ISBN:
9781305251809
Author:
Jay L. Devore
Publisher:
Cengage Learning

Statistics for The Behavioral Sciences (MindTap C…
Statistics
ISBN:
9781305504912
Author:
Frederick J Gravetter, Larry B. Wallnau
Publisher:
Cengage Learning
MATLAB: An Introduction with Applications
Statistics
ISBN:
9781119256830
Author:
Amos Gilat
Publisher:
John Wiley & Sons Inc
Probability and Statistics for Engineering and th…
Statistics
ISBN:
9781305251809
Author:
Jay L. Devore
Publisher:
Cengage Learning
Statistics for The Behavioral Sciences (MindTap C…
Statistics
ISBN:
9781305504912
Author:
Frederick J Gravetter, Larry B. Wallnau
Publisher:
Cengage Learning

Elementary Statistics: Picturing the World (7th E…
Statistics
ISBN:
9780134683416
Author:
Ron Larson, Betsy Farber
Publisher:
PEARSON

The Basic Practice of Statistics
Statistics
ISBN:
9781319042578
Author:
David S. Moore, William I. Notz, Michael A. Fligner
Publisher:
W. H. Freeman

Introduction to the Practice of Statistics
Statistics
ISBN:
9781319013387
Author:
David S. Moore, George P. McCabe, Bruce A. Craig
Publisher:
W. H. Freeman