(a) Write the structural motion equation under earthquake excitation, and then determine the corresponding mass, stiffness and damping matrix. (b) Use the modal decomposition-based method to carry out the structural design. Please calculate the designed base shear and the inter-story drift ratio of the 1" story. The circular frequencies and mode shape vectors of the structure are given as following. (The corresponding tables from the Seismic Design Code is given in the Appendix) (c) Explain why the structural seismic responses are dominated the 1" modal response.
(a) Write the structural motion equation under earthquake excitation, and then determine the corresponding mass, stiffness and damping matrix. (b) Use the modal decomposition-based method to carry out the structural design. Please calculate the designed base shear and the inter-story drift ratio of the 1" story. The circular frequencies and mode shape vectors of the structure are given as following. (The corresponding tables from the Seismic Design Code is given in the Appendix) (c) Explain why the structural seismic responses are dominated the 1" modal response.

Chapter2: Loads On Structures
Section: Chapter Questions
Problem 17P

Related questions

Question
Seismic resistance design
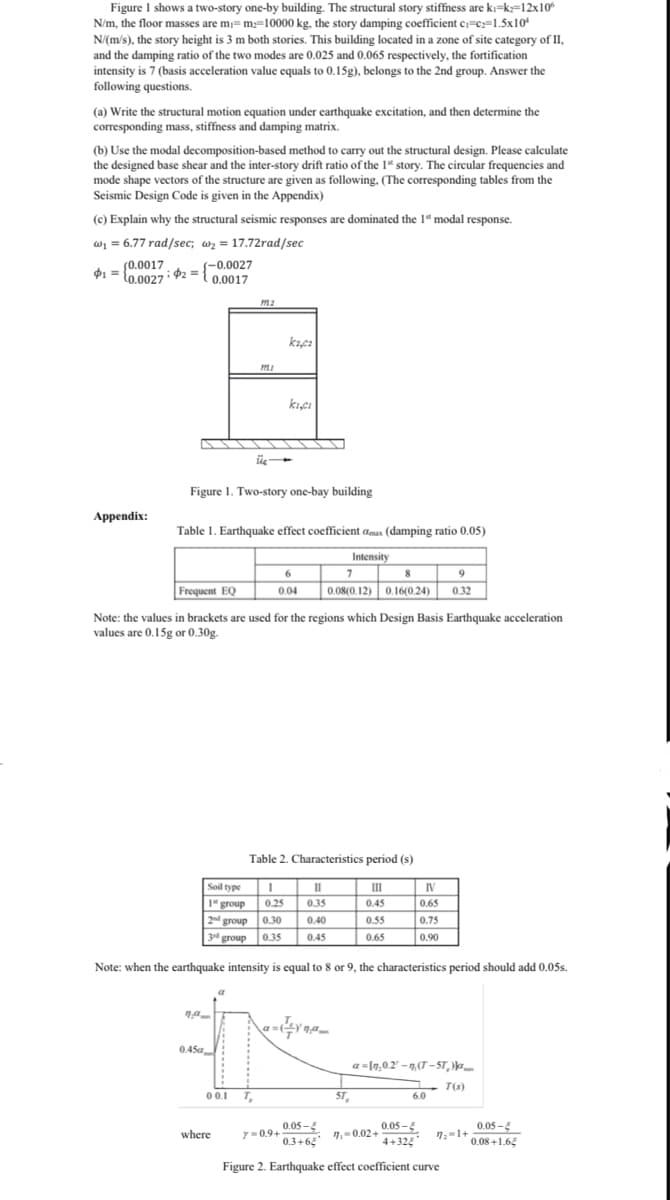
Transcribed Image Text:Figure 1 shows a two-story one-by building. The structural story stiffness are ki-k=12x106
N/m, the floor masses are m₁-m-10000 kg, the story damping coefficient ci-c-1.5x10
N/(m/s), the story height is 3 m both stories. This building located in a zone of site category of II,
and the damping ratio of the two modes are 0.025 and 0.065 respectively, the fortification
intensity is 7 (basis acceleration value equals to 0.15g), belongs to the 2nd group. Answer the
following questions.
(a) Write the structural motion equation under earthquake excitation, and then determine the
corresponding mass, stiffness and damping matrix.
(b) Use the modal decomposition-based method to carry out the structural design. Please calculate
the designed base shear and the inter-story drift ratio of the 1st story. The circular frequencies and
mode shape vectors of the structure are given as following. (The corresponding tables from the
Seismic Design Code is given in the Appendix)
(c) Explain why the structural seismic responses are dominated the 1st modal response.
w₁ = 6.77 rad/sec; w₂= 17.72rad/sec
(0.0017
(-0.0027
$1= 0.0027 $2=0.0017
Appendix:
P.2
Figure 1. Two-story one-bay building
na
üle-
Table 1. Earthquake effect coefficient amax (damping ratio 0.05)
Intensity
0.45a
kaca
0 0.1 T₂
where
ki,ci
Frequent EQ
Note: the values in brackets are used for the regions which Design Basis Earthquake acceleration
values are 0.15g or 0.30g.
6
0.04
Soil type I
1 group
2nd group
3rd group 0.35
Note: when the earthquake intensity is equal to 8 or 9, the characteristics period should add 0.05s.
Table 2. Characteristics period (s)
7
8
9
0.08(0.12) 0.16(0.24) 0.32
II
0.25 0.35
0.30 0.40
0.45
y=0.9+
« = = nan
ST
III
0.45
0.55
0.65
IV
0.65
a= [1,0.2'-n(T-5T)
7,-0.02+
0.75
0.90
0.05-5
0.3+64
Figure 2. Earthquake effect coefficient curve
0.05-5
4+325
6.0
T(s)
0.05-5
0.08+1.64
Expert Solution
This question has been solved!
Explore an expertly crafted, step-by-step solution for a thorough understanding of key concepts.

Step by step
Solved in 6 steps with 10 images

Knowledge Booster


Learn more about
Need a deep-dive on the concept behind this application? Look no further. Learn more about this topic, civil-engineering and related others by exploring similar questions and additional content below.Recommended textbooks for you