a. Calculate the variance of the scores for each woman. b. Are the scores for the younger woman more con- sistent (less variable)? Younger Older 8. 7. 6. 6 8. 7. 8. 8. 8 5 7876
a. Calculate the variance of the scores for each woman. b. Are the scores for the younger woman more con- sistent (less variable)? Younger Older 8. 7. 6. 6 8. 7. 8. 8. 8 5 7876

Algebra & Trigonometry with Analytic Geometry
13th Edition
ISBN:9781133382119
Author:Swokowski
Publisher:Swokowski
Chapter2: Equations And Inequalities
Section2.6: Inequalities
Problem 80E

Related questions
Question
Transcribed Image Text:257
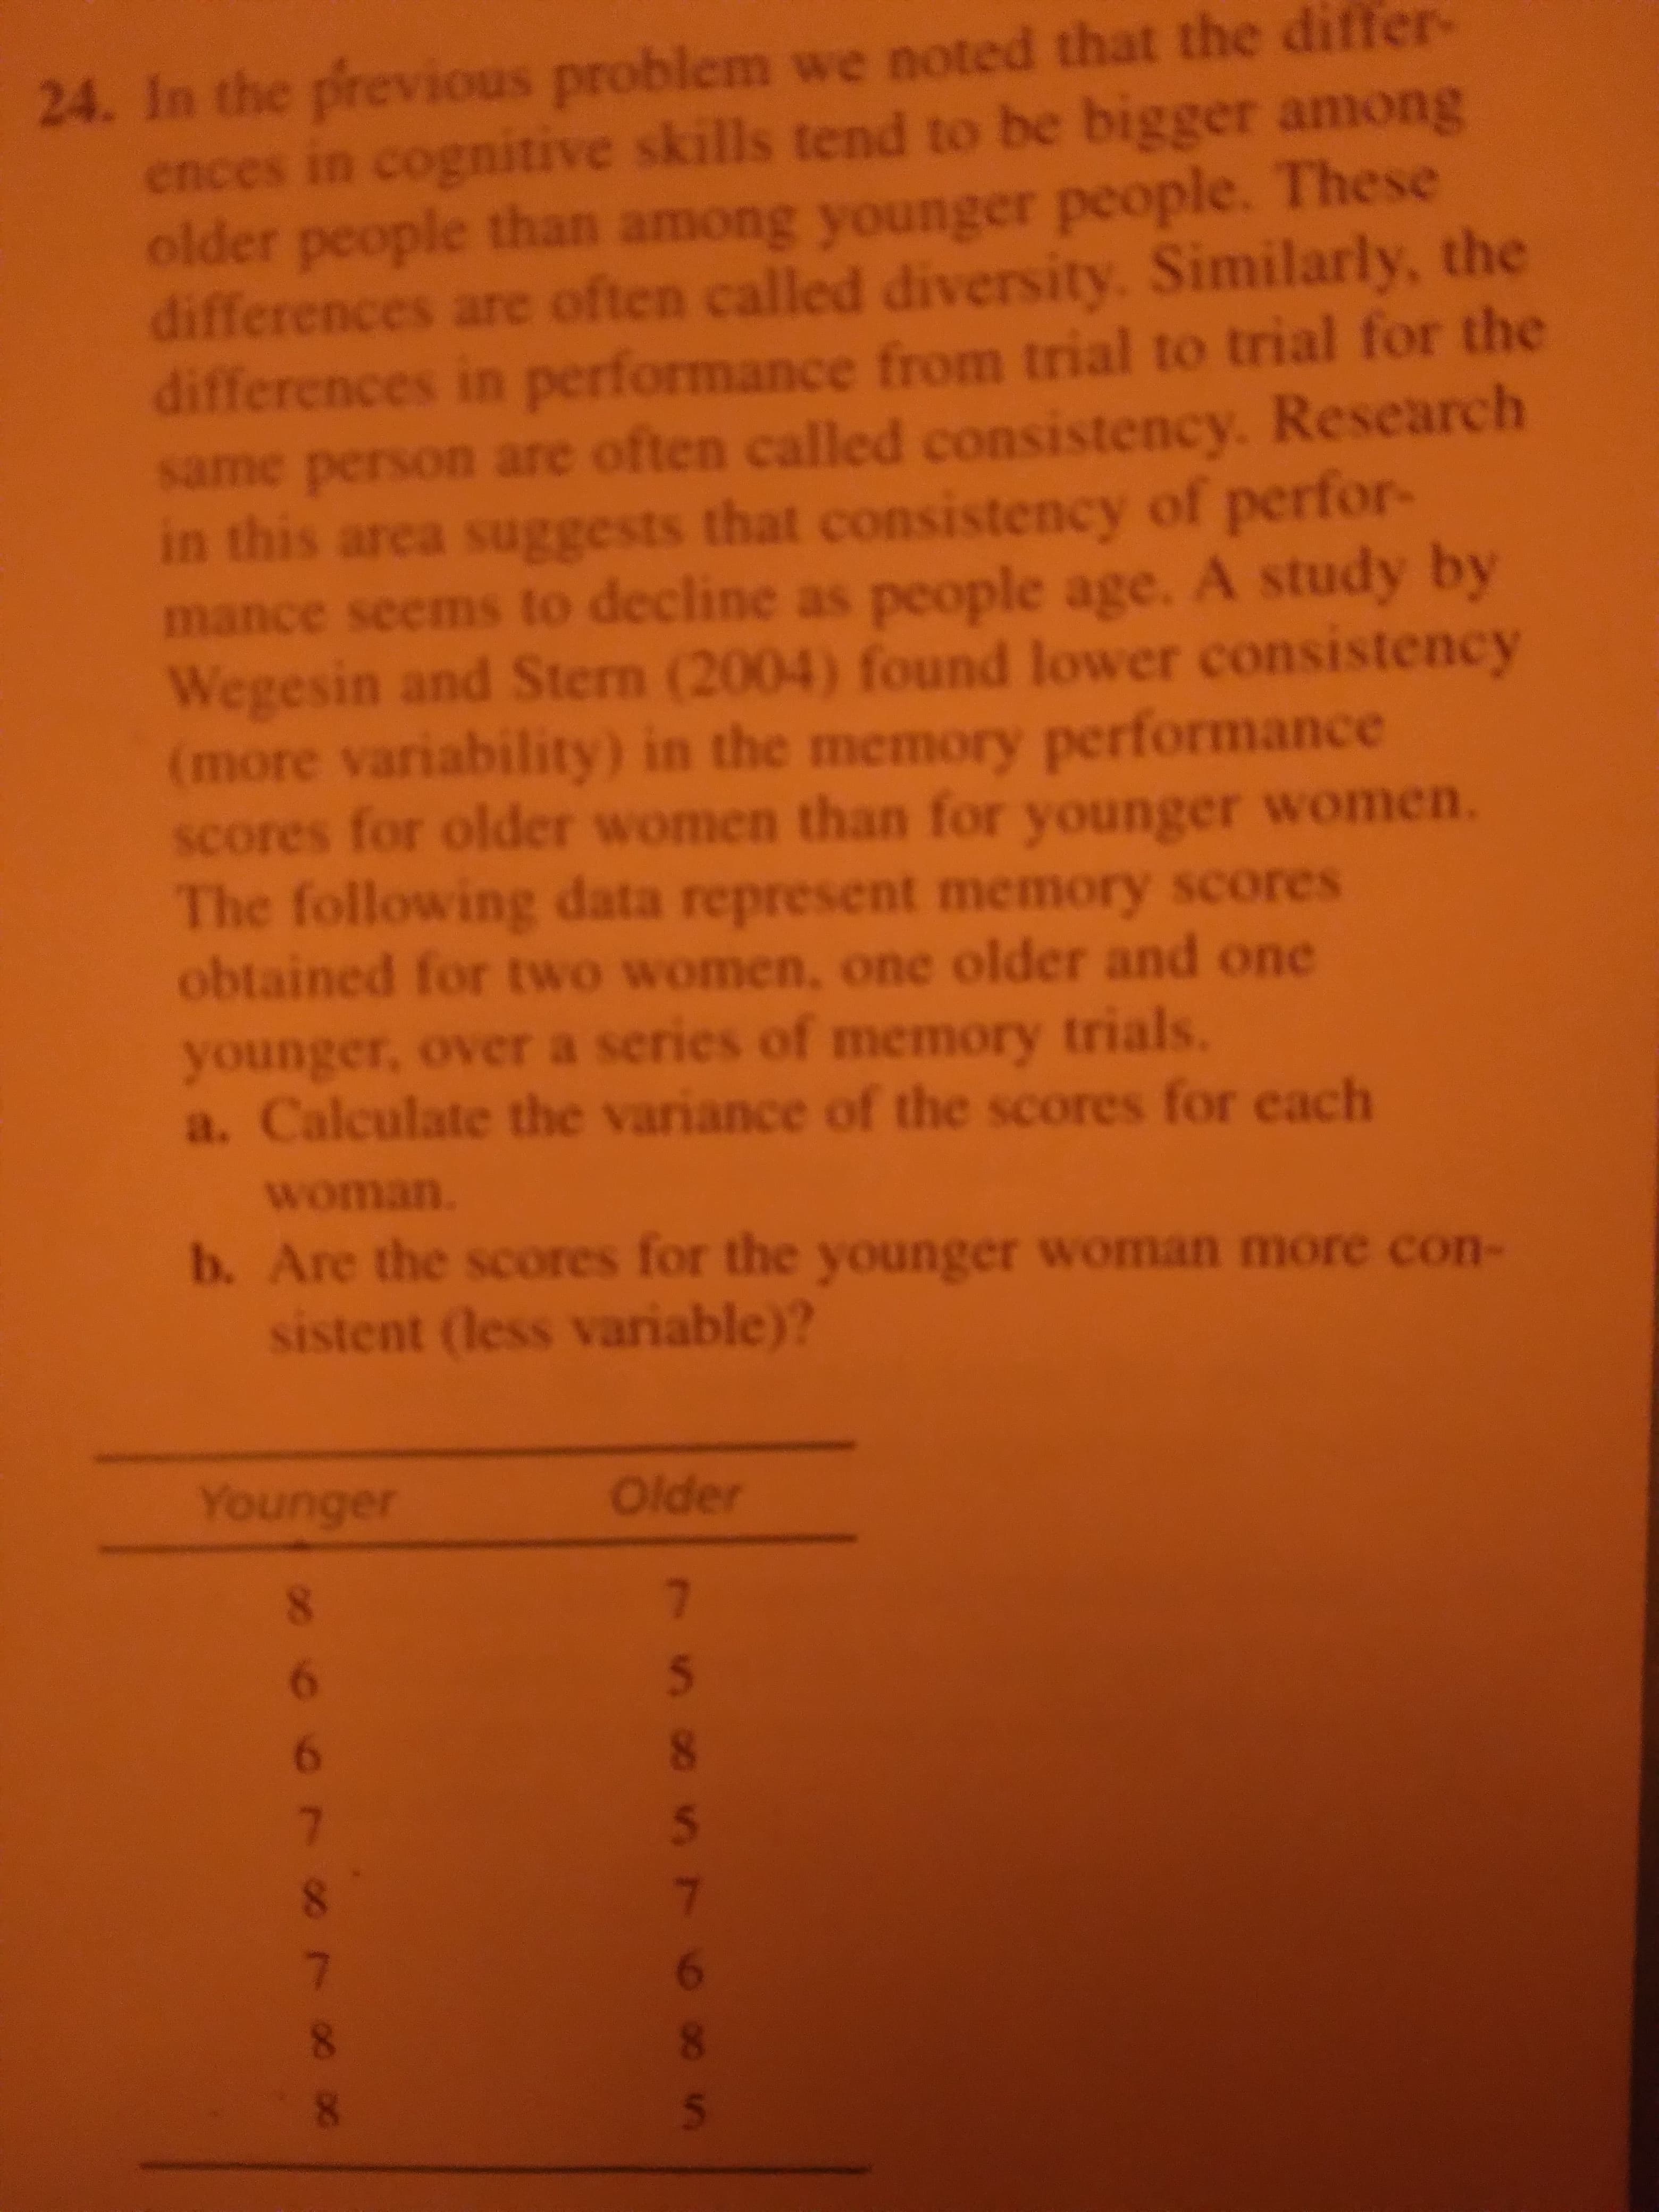
24. In the previous problem we noted that the differ-
ences in cognitive skills tend to be bigger among
older people than among younger people. These
differences are often called diversity. Similarly, the
differences in performance from trial to trial for the
same person are often called consistency. Research
in this area suggests that consistency of perfor-
mance seems to decline as people age. A study by
Wegesin and Stern (2004) found lower consistency
(more variability) in the memory performance
scores for older women than for younger women.
he following data represent memory scores
obtained for two women, one older and one
younger, over a series of memory trials.
a. Calculate the variance of the scores for each
Woman.
b. Are the scores for the younger woman more con-
sistent (less variable)?
Older
8.
9
9
8.
8.
8.
Expert Solution
This question has been solved!
Explore an expertly crafted, step-by-step solution for a thorough understanding of key concepts.

This is a popular solution!

Trending now
This is a popular solution!

Step by step
Solved in 2 steps with 1 images

Recommended textbooks for you
Algebra & Trigonometry with Analytic Geometry
Algebra
ISBN:
9781133382119
Author:
Swokowski
Publisher:
Cengage

Elements Of Modern Algebra
Algebra
ISBN:
9781285463230
Author:
Gilbert, Linda, Jimmie
Publisher:
Cengage Learning,
Algebra & Trigonometry with Analytic Geometry
Algebra
ISBN:
9781133382119
Author:
Swokowski
Publisher:
Cengage
Elements Of Modern Algebra
Algebra
ISBN:
9781285463230
Author:
Gilbert, Linda, Jimmie
Publisher:
Cengage Learning,