a. Determine P , Sp, UCL and LCL for a p chart of 95 percent confidence (at Z= 1.96). (Round your answers to 4 decimal places.) Sp UCL LCL
a. Determine P , Sp, UCL and LCL for a p chart of 95 percent confidence (at Z= 1.96). (Round your answers to 4 decimal places.) Sp UCL LCL

Practical Management Science
6th Edition
ISBN:9781337406659
Author:WINSTON, Wayne L.
Publisher:WINSTON, Wayne L.
Chapter11: Simulation Models
Section: Chapter Questions
Problem 54P

Related questions

Concept explainers
Breakeven Analysis
Break Even Analysis is a term used in business, cost accounting and economics. It refers to a point where the total cost incurred becomes equal to the total revenue earned. Break Even Analysis determines the number of units to be sold to earn the revenue required to cover the total costs. Total cost is a sum total of fixed and variable costs.
Process analysis
The term process analysis can be defined as breakdown of production process into different phases that converts inputs into output. A series of routine activities are incorporated using organizational resources with a view to achieve operational excellence.
Question
can you help me with A.
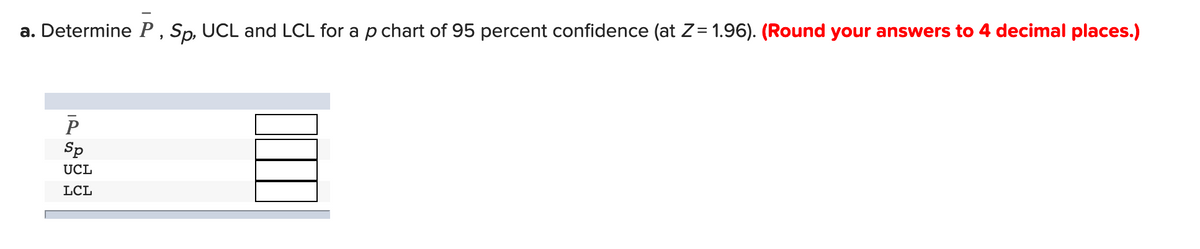
Transcribed Image Text:a. Determine P , Sp, UCL and LCL for a p chart of 95 percent confidence (at Z= 1.96). (Round your answers to 4 decimal places.)
P
Sp
UCL
LCL
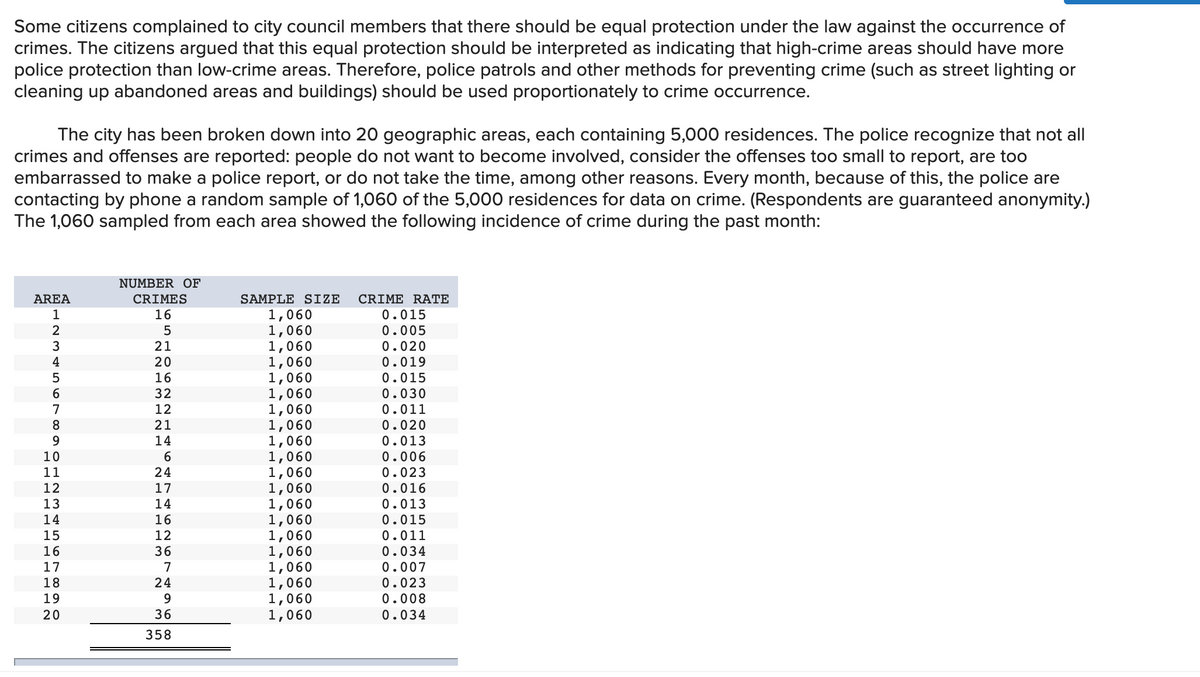
Transcribed Image Text:Some citizens complained to city council members that there should be equal protection under the law against the occurrence of
crimes. The citizens argued that this equal protection should be interpreted as indicating that high-crime areas should have more
police protection than low-crime areas. Therefore, police patrols and other methods for preventing crime (such as street lighting or
cleaning up abandoned areas and buildings) should be used proportionately to crime occurrence.
The city has been broken down into 20 geographic areas, each containing 5,000 residences. The police recognize that not all
crimes and offenses are reported: people do not want to become involved, consider the offenses too small to report, are too
embarrassed to make a police report, or do not take the time, among other reasons. Every month, because of this, the police are
contacting by phone a random sample of 1,060 of the 5,000 residences for data on crime. (Respondents are guaranteed anonymity.)
The 1,060 sampled from each area showed the following incidence of crime during the past month:
NUMBER OF
CRIME RATE
0.015
AREA
CRIMES
SAMPLE SIZE
1,060
1,060
1,060
1,060
1,060
1,060
1,060
1,060
1,060
1,060
1,060
1,060
1,060
1,060
1,060
1,060
1,060
1,060
1,060
1,060
1
16
2
0.005
0.020
0.019
0.015
0.030
0.011
0.020
0.013
0.006
0.023
0.016
0.013
3
21
4
20
16
5
6
7
12
8
9
21
14
10
11
24
12
17
14
13
14
16
12
36
0.015
0.011
0.034
0.007
0.023
0.008
16
17
7
18
19
24
9
20
36
0.034
358
O LO N O
* n O C 0 a
Expert Solution
This question has been solved!
Explore an expertly crafted, step-by-step solution for a thorough understanding of key concepts.

This is a popular solution!

Trending now
This is a popular solution!

Step by step
Solved in 4 steps with 4 images

Knowledge Booster


Learn more about
Need a deep-dive on the concept behind this application? Look no further. Learn more about this topic, operations-management and related others by exploring similar questions and additional content below.Recommended textbooks for you
Practical Management Science
Operations Management
ISBN:
9781337406659
Author:
WINSTON, Wayne L.
Publisher:
Cengage,
Practical Management Science
Operations Management
ISBN:
9781337406659
Author:
WINSTON, Wayne L.
Publisher:
Cengage,