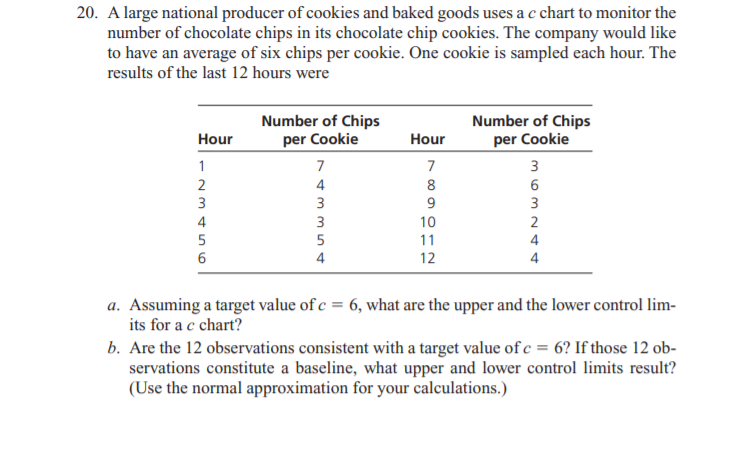
20. A large national producer of cookies and baked goods uses a c chart to monitor the number of chocolate chips in its chocolate chip cookies. The company would like to have an average of six chips per cookie. One cookie is sampled each hour. The results of the last 12 hours were Number of Chips per Cookie Number of Chips per Cookie Hour Hour 1 7 7 3 2 8 6 3 4 3 3 4 3 10 2 5 5 11 4 4 12 4 a. Assuming a target value of c = 6, what are the upper and the lower control lim- its for a c chart? b. Are the 12 observations consistent with a target value of c = 6? If those 12 ob- servations constitute a baseline, what upper and lower control limits result? (Use the normal approximation for your calculations.)
20. A large national producer of cookies and baked goods uses a c chart to monitor the number of chocolate chips in its chocolate chip cookies. The company would like to have an average of six chips per cookie. One cookie is sampled each hour. The results of the last 12 hours were Number of Chips per Cookie Number of Chips per Cookie Hour Hour 1 7 7 3 2 8 6 3 4 3 3 4 3 10 2 5 5 11 4 4 12 4 a. Assuming a target value of c = 6, what are the upper and the lower control lim- its for a c chart? b. Are the 12 observations consistent with a target value of c = 6? If those 12 ob- servations constitute a baseline, what upper and lower control limits result? (Use the normal approximation for your calculations.)

Practical Management Science
6th Edition
ISBN:9781337406659
Author:WINSTON, Wayne L.
Publisher:WINSTON, Wayne L.
Chapter2: Introduction To Spreadsheet Modeling
Section: Chapter Questions
Problem 20P: Julie James is opening a lemonade stand. She believes the fixed cost per week of running the stand...

Related questions
Question
Transcribed Image Text:20. A large national producer of cookies and baked goods uses a c chart to monitor the
number of chocolate chips in its chocolate chip cookies. The company would like
to have an average of six chips per cookie. One cookie is sampled each hour. The
results of the last 12 hours were
Number of Chips
per Cookie
Number of Chips
per Cookie
Hour
Hour
1
7
7
3
2
8
6
3
4
3
3
4
3
10
2
5
5
11
4
4
12
4
a. Assuming a target value of c = 6, what are the upper and the lower control lim-
its for a c chart?
b. Are the 12 observations consistent with a target value of c = 6? If those 12 ob-
servations constitute a baseline, what upper and lower control limits result?
(Use the normal approximation for your calculations.)
Expert Solution
This question has been solved!
Explore an expertly crafted, step-by-step solution for a thorough understanding of key concepts.

This is a popular solution!

Trending now
This is a popular solution!

Step by step
Solved in 2 steps with 2 images

Recommended textbooks for you
Practical Management Science
Operations Management
ISBN:
9781337406659
Author:
WINSTON, Wayne L.
Publisher:
Cengage,

Operations Management
Operations Management
ISBN:
9781259667473
Author:
William J Stevenson
Publisher:
McGraw-Hill Education

Operations and Supply Chain Management (Mcgraw-hi…
Operations Management
ISBN:
9781259666100
Author:
F. Robert Jacobs, Richard B Chase
Publisher:
McGraw-Hill Education
Practical Management Science
Operations Management
ISBN:
9781337406659
Author:
WINSTON, Wayne L.
Publisher:
Cengage,
Operations Management
Operations Management
ISBN:
9781259667473
Author:
William J Stevenson
Publisher:
McGraw-Hill Education
Operations and Supply Chain Management (Mcgraw-hi…
Operations Management
ISBN:
9781259666100
Author:
F. Robert Jacobs, Richard B Chase
Publisher:
McGraw-Hill Education


Purchasing and Supply Chain Management
Operations Management
ISBN:
9781285869681
Author:
Robert M. Monczka, Robert B. Handfield, Larry C. Giunipero, James L. Patterson
Publisher:
Cengage Learning

Production and Operations Analysis, Seventh Editi…
Operations Management
ISBN:
9781478623069
Author:
Steven Nahmias, Tava Lennon Olsen
Publisher:
Waveland Press, Inc.