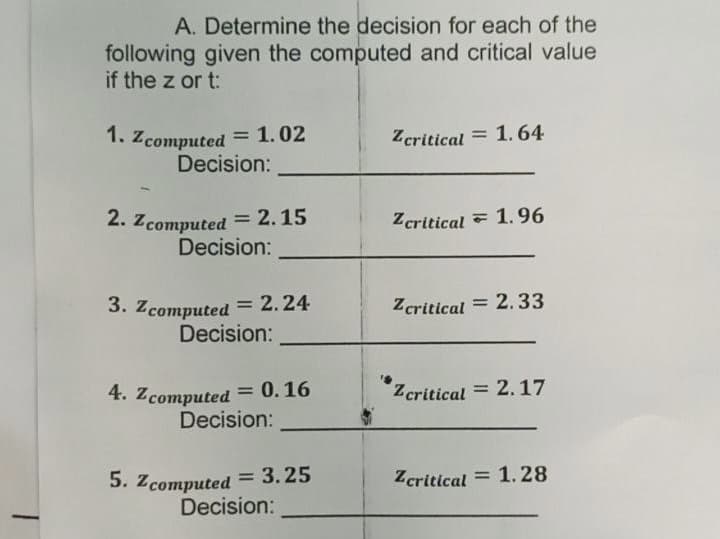
A. Determine the decision for each of the following given the computed and critical value if the z or t: 1. Zcomputed = 1.02 Decision: %3D Zcritical = 1.64 2. Zcomputed = 2.15 Decision: %3D Zcritical = 1.96 3. Zcomputed = 2.24 %3D Zcritical = 2.33


Q: A certain collector is choosing between 4 different paintings to buy. To help him decide, he asked…
A: Null and Alternative Hypothesis: Ho: u1=u2=u3=u4 Ha: At least one painting is preferred more
Q: 2. Dale conducted a survey of the students in his cla to observe the distribution of eye color. The…
A:
Q: L'Rglection Direction: Find the interval estimate of the following problem. 1. Aandom sample of 70…
A: As per the Bartleby guildlines we have to solve first question and rest can be reposted... 1... A…
Q: Draw a comics strip on how to determine the appropriate tool when the variance is known, variance is…
A: The central limit theorem An essential component of the central limit theorem is that the…
Q: Sara Jenkins notices that sales of several items that her company manufactures have shown a stable…
A: Given problem Given that Sara Jenkins notices that sales of several items that her company…
Q: Compute for a 90% confidence interval estimate for µ=mean score in the reading comprehension test of…
A:
Q: na study of cell phone usage and brain hemispheric dominance, an Internet survey was e-mailed to…
A:
Q: One of the most feared predators is the great white shark, which can grow to a mean length of 21…
A: Given, population mean (µ) = 21 sample size (n) = 3
Q: Gini coefficient is a statistic used to measure income inequality within nations. It ranges from 0…
A: The regression line of Y (i.e., the Gini score) on X (i.e., the population size) is given as: Y=a+bX…
Q: Let x be a random variable that represents the pH of arterial plasma (i.e., acidity of the blood).…
A: a. Consider that μ is the population mean pH level of the blood.
Q: . What is the test statistic? Z= C. What is the p value?
A:
Q: 2. The following data are selected randomly from the population of normally distributed values. 29…
A:
Q: a. Identify the actual number of respondents who rated themselves as above average drivers. 933…
A:
Q: give a situation (real life situation) that best explain the given
A: Accuracy of an estimator refers to the closeness of a measure from the true value of the parameter.…
Q: Before microwave ovens are sold, the manufacturer must check to ensure that the radiation coming…
A: Solution-: We have following data: 15,5,5,9,9,8,3,8,18,10,5,18,10,7,15,1,5,2,10,2,12,1,15,11,8 We…
Q: III Determine the type of Kurtosis of the given sets of scores in 10 quizzes of two students. Graph…
A: Data is given for, Students (A & B) We have to calculate kurtosis and we have to tell type of…
Q: If n=22, ¯xx¯(x-bar)=39, and s=6, find the margin of error at a 98% confidence level Give your…
A:
Q: An aircraft is used to fire at a target. It will be successful if 2 or more bombs hit the target. If…
A:
Q: Problem Four: In a dental clinic with one dentist, the average number of patients from time to time…
A: Given Total number of patients per day =2
Q: 8. A quality control specialist for a five-star hotel restaurant takes a random sample of size 12 to…
A: We have to solve, Mentioned 3 subparts, Used formulas E= (upper limit - lower limit)/2 We have to…
Q: A public school is considering the revision of its Reading course. The school believes that the…
A:
Q: The target thickness of aluminum sheets produced by a machine is 5 mm. A sample of 50 sheets is…
A: Given: Sample size,n=50Sample mean, x¯=0.46Sample sd. s=0.36α=0.05
Q: Does this provide evidence to support the claim of the nutritionist?
A:
Q: Question 4 Men's heights are normally distributed with a mean of 69.0 inches and a standard…
A: Given that For women Mean = 63.6 ,s.d =2.5 For men mean = 69,s.d =2.8
Q: The height (in feet) and trunk circumference (in inches) at breast height (4.5 feet above the…
A: The height (in feet) and trunk circumference (in inches) at breast height (4.5 feet above the…
Q: Is the national crime rate really going down? Some sociologists say yes! They say that the reason…
A: a) Consider that p is the true proportion of arrests of males aged 15 to 39 years.
Q: An important issue in conservation biology is how dispersal among populations influences the…
A:
Q: Suppose Z follows the standard normal distribution. Use the calculator provided, or this table, to…
A: The answer is attached below,
Q: table below. Is there compelling statistical evidence that the mean resting pulse rate of people who…
A: Given Data : For Sample 1 x̄1 = 75 s1 = 9 n1 = 16 For Sample 2 x̄2 = 69…
Q: Calculate the sample standard deviation for the following data set. If necessary, round to one more…
A: Given the data 0.428 0.386 0.429 0.391 0.453 0.391 0.467 0.414 0.447 0.424 0.435 0.414 0.393 0.406…
Q: a. What is the probability that the demand for gasoline in a given week is more than 500 gallons? b.…
A:
Q: 9. Show that if t is a consistent estimator of 0, then t is a consistent estimator of e.
A:
Q: 2. A past study claims that adults in America spend an average of 17 hours a week on leisure…
A:
Q: 7 Example 2 (a). Show that the sample of 1/0 for distribution. mean x is an unbiased estimator
A:
Q: e. Determine if there is relationship between the age of person in years and their weight in kg sing…
A:
Q: (a) What is the level of significance? State the null and alternate hypotheses. Ho: My Hz (b) What…
A: For the given data Perform z test two population means
Q: By referring to the first graph, the define the type of risks: 1.1. Total Risk. 1.2.…
A: The define the type of risks: Total Risk. Systematic Risk (Non-Diversifiable Risk) Unsystematic…
Q: The pH factor is a measurement of how acidic or alkaline water is. A reading of 7.0 indicates…
A: Solution: Let X be the pH level. The data for X is 7.3, 7.4, 7.2, 7.0, 7.5, 7.4, 7.3, 7.3, 7.2 and…
Q: 14. Which of the following does not belong to the group? b. Interpretation 14 c. Possibilities 15.…
A: “Since you have asked multiple questions, we will solve the first question for you. If you want any…
Q: L-5 Ex1 Let x ~B eta Cxr B) Finel 2ocation Sacale framilu for B dis tribution
A: Given that Let X follows Beta(α, β) Then we have to find the location and scale family of Beta…
Q: A college math teacher claims that the mean score of students in his Statistics class is greater…
A: For the given data Perform Z test for one mean
Q: Find the standard deviation of the following -14, -4,-10, -12, 5, -1.
A:
Q: Identify the null hypothesis, alternative hypothesis, test statistic, P-value, conclusion about the…
A: See below
Q: 3/21 Question 1 of 7, Step 5 of 5 Correct Consider the following frequency table representing the…
A:
Q: 6.26 Use Theorem 6.6.5 to establish that, given a sample X1,..., Xn, the following statistics are…
A: Given that -
Q: Null Hypothesis, HO Alternative Hypothesis, H1 Test Statistic, t >
A: We have given that Sample mean, x̅ = 9000 standard deviation, s = 1000 Sample size, n = 243 Note:…
Q: etters in each word, and obtain the mean and standard deviation of the yes were blue blue as autumn…
A: *Answer:
Q: An important issue in conservation biology is how dispersal among populations influences the…
A:
Q: Hundreds of thousands of people infected Number of countries [1.0;3.0) 5 [3.0;5.0) 8 [5.0;7.0) 17…
A:
Q: We want to test the null hypothesis that population mean = 10. Using the following observations,…
A: Given that, xbar=10 Data =2, 3,4,5,6,7,8 We have to find t test statistics


Trending now
This is a popular solution!

Step by step
Solved in 2 steps

- Nine laboratory equipment dealers were asked for price quotes on two similar air quality samplers. The results of the survey are given below. At α = 0.05, is it reasonable to assert that on an average, sampler manufactured by company A is less expensive than sampler manufactured by company B?Dealer 1 2 3 4 5 6 7 8 9Company A price (in $) 250 319 285 260 305 295 289 309 275Company B price (in $) 270 325 269 275 289 285 295 325 300The table below summarizes data from a survey of a sample of women. Using a 0.01significance level, and assuming that the sample sizes of 800 men and 300 women are predetermined, test the claim that the proportions of agree/disagree responses are the same for subjects interviewed by men and the subjects interviewed by women. Does it appear that the gender of the interviewer affected the responses of women? Gender of Interviewer Man Woman Women who agree 498 247 Women who disagree 302 53 Compute the test statistic, rounding to three decimal places. Find the critical value(s). (Round to three decimal places) What is the conclusion based on the hypothesis test?Use the Kruskal-Wallis Test and α = 0.05 to determine whether there is significant difference in the performance ratings forthe products.
- It was reported that in the nuclear industry, it is significant to keep detailed records of the quantity of plutonium received, transported, or used. Each shipment of plutonium pellets received is carefully analyzed to check that the purity and hence the total quantity is as claimed by the supplier. A particular shipment is analyzed with the following results: 99.93, 99.87, 99.91, and 99.89%. The listed purity as received from the supplier is 99.95%,Using a suitable test, propose whether this shipment is acceptable at a 95% confidence level.The number of contaminating particles on a silicon waferprior to a certain rinsing process was determined for eachwafer in a sample of size 100, resulting in the followingfrequencies:Number of particles 0 1 2 3 4 5 6 7Frequency 1 2 3 12 11 15 18 10Number of particles 8 9 10 11 12 13 14Frequency 12 4 5 3 1 2 1a. What proportion of the sampled wafers had at leastone particle? At least five particles?b. What proportion of the sampled wafers had betweenfive and ten particles, inclusive? Strictly between fiveand ten particles?c. Draw a histogram using relative frequency on thevertical axis. How would you describe the shape of thehistogram?Fill the chi square for Cross 1 and Cross 2 from the following data in the attached image: Cross 1: Phenotypes Ratio Observed Expected (O-E)2/E Totals X2 = Cross 2: Phenotypes Ratio Observed Expected (O-E)2/E Totals X2 =
- The mean ±1 sd of ln [calcium intake (mg)] among 25females, 12 to 14 years of age, below the poverty level is6.56 ± 0.64. Similarly, the mean ± 1 sd of ln [calcium intake(mg)] among 40 females, 12 to 14 years of age, above thepoverty level is 6.80 ± 0.76 5-Compute a 95% CI for the difference in meansbetween the two groupsA mining company finds that daily lost-work injuries average 1.2. If the local union contract has a clause requiring that the mine be shut down as soon as three workers incur lost-work injuries, on what percentage of the days will the mine be operational throughout the day?The average 1-year-old is 29 inches tall. A random sample of 30 one-year-olds in a large day carefranchise resulted in the following heights. At a = 0.05, can it be concluded that the averageheight differs from 29 inches? Assume o = 2.61 2532 35 25 30 26.5 26 25.5 29.5 32 28.5 30 32 28 31.5 30 27 28 33 28 29 32 29 27 29.5 32 30 29 34 29.5
- A random sample of soil specimens was obtained, andthe amount of organic matter (%) in the soil was determined for each specimen, resulting in the accompanyingdata (from “Engineering Properties of Soil,” SoilScience, 1998: 93–102). 1.10 5.09 0.97 1.59 4.60 0.32 0.55 1.450.14 4.47 1.20 3.50 5.02 4.67 5.22 2.693.98 3.17 3.03 2.21 0.69 4.47 3.31 1.170.76 1.17 1.57 2.62 1.66 2.05190 200 210 220The values of the sample mean, sample standard deviation, and (estimated) standard error of the mean are2.481, 1.616, and .295, respectively. Does this data suggest that the true average percentage of organic matterin such soil is something other than 3%? Carry out atest of the appropriate hypotheses at significance level.10. Would your conclusion be different if a 5 .05 hadbeen used? [Note: A normal probability plot of the datashows an acceptable pattern in light of the reasonablylarge sample size.]For a population with µ = 40 and σ = 5, compute the z-score corresponding to each of the following X values: 41, 47, 33, 28The mean ±1 sd of ln [calcium intake (mg)] among 25females, 12 to 14 years of age, below the poverty level is6.56 ± 0.64. Similarly, the mean ± 1 sd of ln [calcium intake(mg)] among 40 females, 12 to 14 years of age, above thepoverty level is 6.80 ± 0.76.8.6 Compute a 95% CI for the difference in meansbetween the two groups