A. Determine the lowest and highest value of the unorganized data shown below. 48 73 57 57 69 88 11 80 82 47 46 70 49 45 75 81 33 65 38 59 94 59 62 36 58 69 45 55 58 65 30 49 73 29 41 53 37 35 61 48 22 51 56 55 60 37 56 59 57 36 12 36 50 63 68 30 56 70 53 28 Highest: Lowest: B. Using the ungrouped data above determine the frequency of each class by counting the number of items that fall in each interval. An example Class 11-22 has an f=3, (11,12 and 22). Also determine the midpoint of the interval "x". An example is also given below. 11+22 := 16.5 Frequency Distribution The "n" is the total number of f. Classes f 11-22 3 16.5 23-34 35-46 47-58 59-70 71-82 83-94 C. Draw a bar graph of the frequency vs the class interval using the data that you have answered above. HISTOGRAM Frequency vs. Class Interval 20 18 16 14 12 10 8. 6 2 11-22 23-34 35-46 47-58 59-70 71-82 83-94 Frequency
A. Determine the lowest and highest value of the unorganized data shown below. 48 73 57 57 69 88 11 80 82 47 46 70 49 45 75 81 33 65 38 59 94 59 62 36 58 69 45 55 58 65 30 49 73 29 41 53 37 35 61 48 22 51 56 55 60 37 56 59 57 36 12 36 50 63 68 30 56 70 53 28 Highest: Lowest: B. Using the ungrouped data above determine the frequency of each class by counting the number of items that fall in each interval. An example Class 11-22 has an f=3, (11,12 and 22). Also determine the midpoint of the interval "x". An example is also given below. 11+22 := 16.5 Frequency Distribution The "n" is the total number of f. Classes f 11-22 3 16.5 23-34 35-46 47-58 59-70 71-82 83-94 C. Draw a bar graph of the frequency vs the class interval using the data that you have answered above. HISTOGRAM Frequency vs. Class Interval 20 18 16 14 12 10 8. 6 2 11-22 23-34 35-46 47-58 59-70 71-82 83-94 Frequency

MATLAB: An Introduction with Applications
6th Edition
ISBN:9781119256830
Author:Amos Gilat
Publisher:Amos Gilat
Chapter1: Starting With Matlab
Section: Chapter Questions
Problem 1P

Related questions
Question
Transcribed Image Text:A. Based on the previous activity, discuss how the unorganized data transformed to become a
histogram and frequency polygon. Determine the lacking steps or procedure of the
transformation.
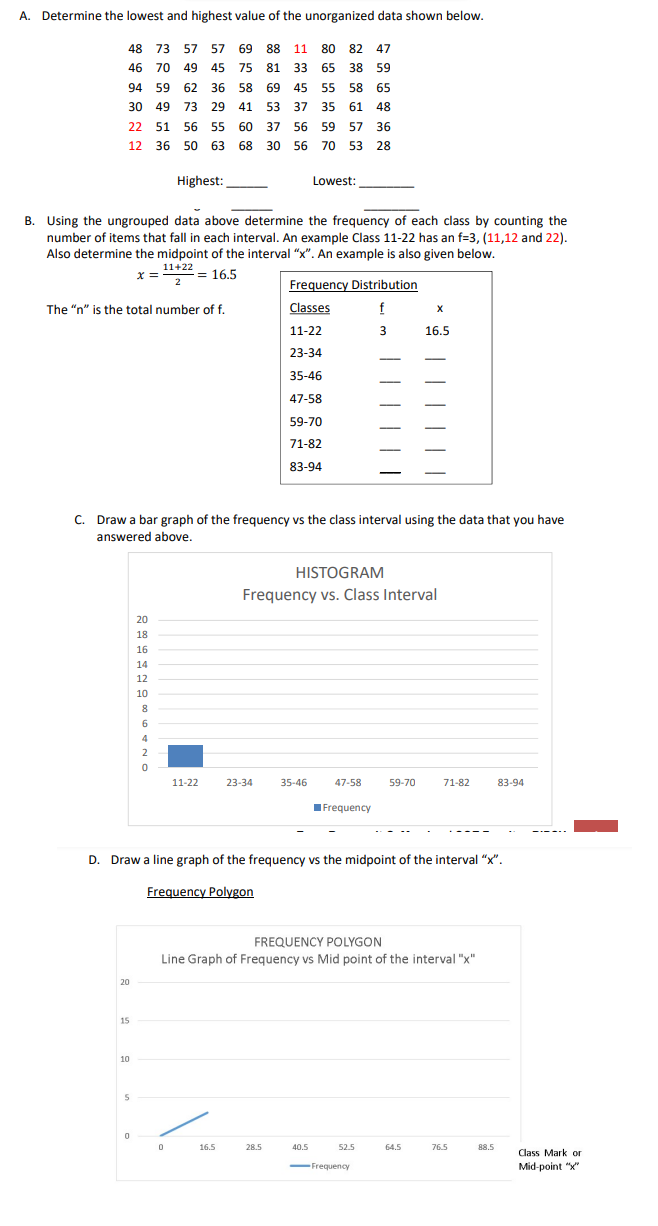
Transcribed Image Text:A. Determine the lowest and highest value of the unorganized data shown below.
48 73 57 57 69 88 11 80 82 47
46 70 49 45 75 81 33 65 38 59
94 59 62 36 58 69 45 55 58
65
30 49
73 29 41 53 37 35
61
48
22 51 56 55
60
37
56
59 57 36
12 36
50 63
68
30
56
70 53 28
Highest:
Lowest:
B. Using the ungrouped data above determine the frequency of each class by counting the
number of items that fall in each interval. An example Class 11-22 has an f=3, (11,12 and 22).
Also determine the midpoint of the interval "x". An example is also given below.
11+22
x = = 16.5
2
Frequency Distribution
The "n" is the total number of f.
Classes
f
11-22
3
16.5
23-34
35-46
47-58
59-70
71-82
83-94
C. Draw a bar graph of the frequency vs the class interval using the data that you have
answered above.
HISTOGRAM
Frequency vs. Class Interval
20
18
16
14
12
10
8.
6.
2
11-22
23-34
35-46
47-58
59-70
71-82
83-94
Frequency
D. Draw a line graph of the frequency vs the midpoint of the interval "x".
Frequency Polygon
FREQUENCY POLYGON
Line Graph of Frequency vs Mid point of the interval "x"
20
15
10
16.5
28.5
40.5
52.5
64.5
76.5
88.5
Class Mark or
Frequency
Mid-point "X"
Expert Solution
This question has been solved!
Explore an expertly crafted, step-by-step solution for a thorough understanding of key concepts.

This is a popular solution!

Trending now
This is a popular solution!

Step by step
Solved in 3 steps with 1 images

Recommended textbooks for you
MATLAB: An Introduction with Applications
Statistics
ISBN:
9781119256830
Author:
Amos Gilat
Publisher:
John Wiley & Sons Inc

Probability and Statistics for Engineering and th…
Statistics
ISBN:
9781305251809
Author:
Jay L. Devore
Publisher:
Cengage Learning

Statistics for The Behavioral Sciences (MindTap C…
Statistics
ISBN:
9781305504912
Author:
Frederick J Gravetter, Larry B. Wallnau
Publisher:
Cengage Learning
MATLAB: An Introduction with Applications
Statistics
ISBN:
9781119256830
Author:
Amos Gilat
Publisher:
John Wiley & Sons Inc
Probability and Statistics for Engineering and th…
Statistics
ISBN:
9781305251809
Author:
Jay L. Devore
Publisher:
Cengage Learning
Statistics for The Behavioral Sciences (MindTap C…
Statistics
ISBN:
9781305504912
Author:
Frederick J Gravetter, Larry B. Wallnau
Publisher:
Cengage Learning

Elementary Statistics: Picturing the World (7th E…
Statistics
ISBN:
9780134683416
Author:
Ron Larson, Betsy Farber
Publisher:
PEARSON

The Basic Practice of Statistics
Statistics
ISBN:
9781319042578
Author:
David S. Moore, William I. Notz, Michael A. Fligner
Publisher:
W. H. Freeman

Introduction to the Practice of Statistics
Statistics
ISBN:
9781319013387
Author:
David S. Moore, George P. McCabe, Bruce A. Craig
Publisher:
W. H. Freeman