The following contingency table provides a joint frequency distribution for a group of retired people by age at retirement and career. Age at Retirement 50-55 56-60 61-65 Over 65 Total A3 A1 A2 A4 Attorney 10 40 75 40 165 C1 Career College Professor 30 80 60 175 C2 Secretary 21 45 63 49 178 C3 Store Clerk 18 44 70 50 182 C4 Total 54 159 288 199 700 How many of these people were not attorneys when they retired? 44 535 165 690
The following contingency table provides a joint frequency distribution for a group of retired people by age at retirement and career. Age at Retirement 50-55 56-60 61-65 Over 65 Total A3 A1 A2 A4 Attorney 10 40 75 40 165 C1 Career College Professor 30 80 60 175 C2 Secretary 21 45 63 49 178 C3 Store Clerk 18 44 70 50 182 C4 Total 54 159 288 199 700 How many of these people were not attorneys when they retired? 44 535 165 690

Glencoe Algebra 1, Student Edition, 9780079039897, 0079039898, 2018
18th Edition
ISBN:9780079039897
Author:Carter
Publisher:Carter
Chapter10: Statistics
Section10.6: Summarizing Categorical Data
Problem 4AGP

Related questions
Question
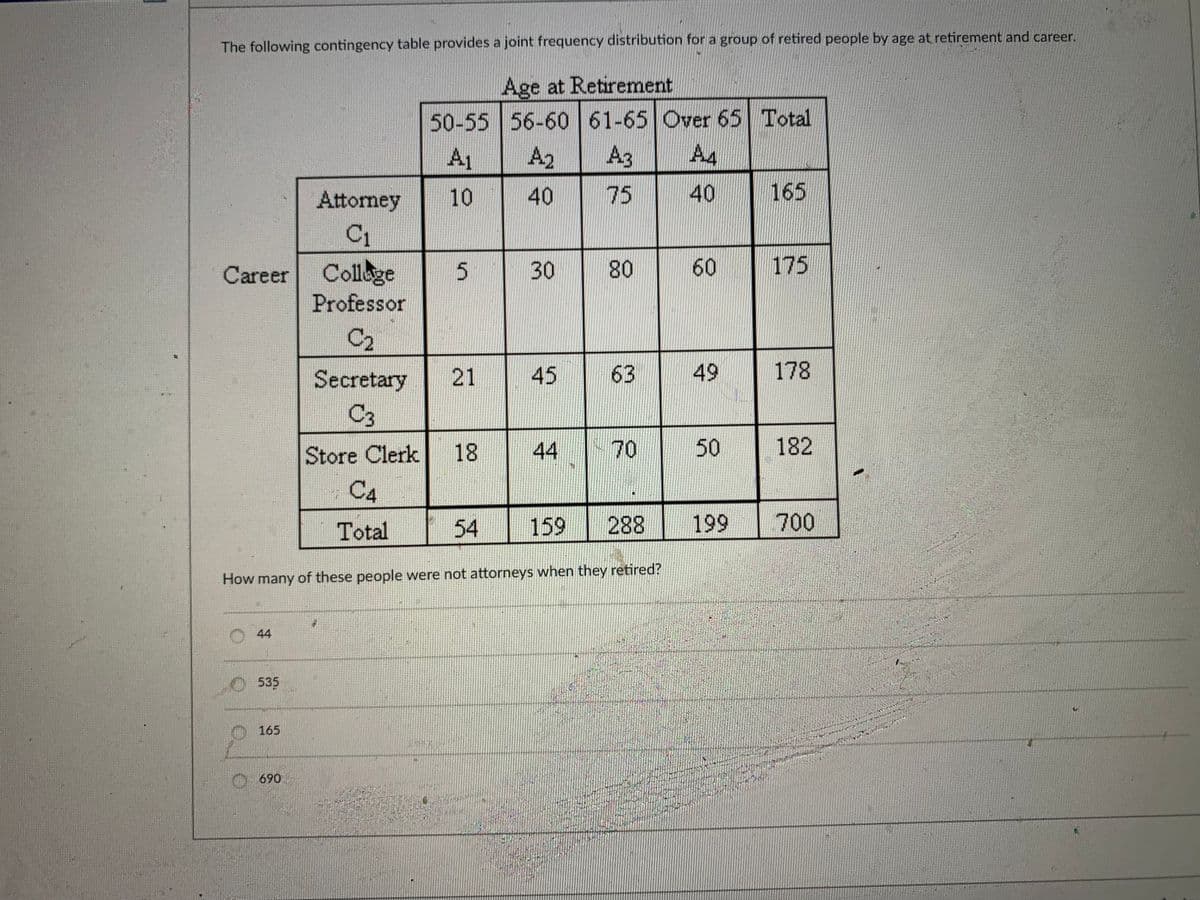
Transcribed Image Text:The following contingency table provides a joint frequency distribution for a group of retired people by age at retirement and career.
Age at Retirement
50-55 56-60 61-65 Over 65 Total
A1
A2
A3
A4
10
40
75
40
165
Attorney
C1
Career
College
5.
30
80
60
175
Professor
C2
Secretary
21
45
63
49
178
C3
Store Clerk
18
44
50
182
C4
Total
54
159
288
199
700
How many of these people were not attorneys when they retired?
44
535
165
690
70
Expert Solution
This question has been solved!
Explore an expertly crafted, step-by-step solution for a thorough understanding of key concepts.

This is a popular solution!

Trending now
This is a popular solution!

Step by step
Solved in 2 steps

Recommended textbooks for you
Glencoe Algebra 1, Student Edition, 9780079039897…
Algebra
ISBN:
9780079039897
Author:
Carter
Publisher:
McGraw Hill
Glencoe Algebra 1, Student Edition, 9780079039897…
Algebra
ISBN:
9780079039897
Author:
Carter
Publisher:
McGraw Hill