a. Develop a scatter diagram with the number of cars in service as the independent variable. What does the scatter diagram developed in part (a) indicate about the relationship between the two variables? b. Develop and interprete the estimated regression equation C. Does the above data provide a good model fit for the estimate regression equation?

Elementary Geometry for College Students
6th Edition
ISBN:9781285195698
Author:Daniel C. Alexander, Geralyn M. Koeberlein
Publisher:Daniel C. Alexander, Geralyn M. Koeberlein
ChapterA: Appendices
SectionA.1: Algebraic Expressions
Problem 2E
icon
Related questions
icon
Concept explainers
Question
100%
beauty
4. To help Companies in the U.S. car rental market vary greatly in terms of the size of the
fleet, the number of locations, and annual revenue. In 2011, Hertz had 320,000 cars in
service and annual revenue of approximately $4.2 billion. The following data show the
number of cars in service (1000s) and the annual revenue ($millions) for six smaller car
rental companies.
Company
U-Save Auto Rental System, Inc.
Cars (1000s)
Revenue ($millions)
111.5
1182
Payless Car Rental System, Inc.
100.0
1353
ACE Rent A Car
93.3
1004
Rent-A-Wreck of America
54.5
373
Triangle Rent-A-Car
47.2
409
Affordable/Sensible
35.3
327
a. Develop a scatter diagram with the number of cars in service as the independent
variable. What does the scatter diagram developed in part (a) indicate about the
relationship between the two variables?
b. Develop and interprete the estimated regression equation
C. Does the above data provide a good model fit for the estimate regression
equation?
5. According to the Ameriprise Financial Money Across Generations study, 9 out of 10 parents
近
Transcribed Image Text:beauty 4. To help Companies in the U.S. car rental market vary greatly in terms of the size of the fleet, the number of locations, and annual revenue. In 2011, Hertz had 320,000 cars in service and annual revenue of approximately $4.2 billion. The following data show the number of cars in service (1000s) and the annual revenue ($millions) for six smaller car rental companies. Company U-Save Auto Rental System, Inc. Cars (1000s) Revenue ($millions) 111.5 1182 Payless Car Rental System, Inc. 100.0 1353 ACE Rent A Car 93.3 1004 Rent-A-Wreck of America 54.5 373 Triangle Rent-A-Car 47.2 409 Affordable/Sensible 35.3 327 a. Develop a scatter diagram with the number of cars in service as the independent variable. What does the scatter diagram developed in part (a) indicate about the relationship between the two variables? b. Develop and interprete the estimated regression equation C. Does the above data provide a good model fit for the estimate regression equation? 5. According to the Ameriprise Financial Money Across Generations study, 9 out of 10 parents 近
Expert Solution
Step 1

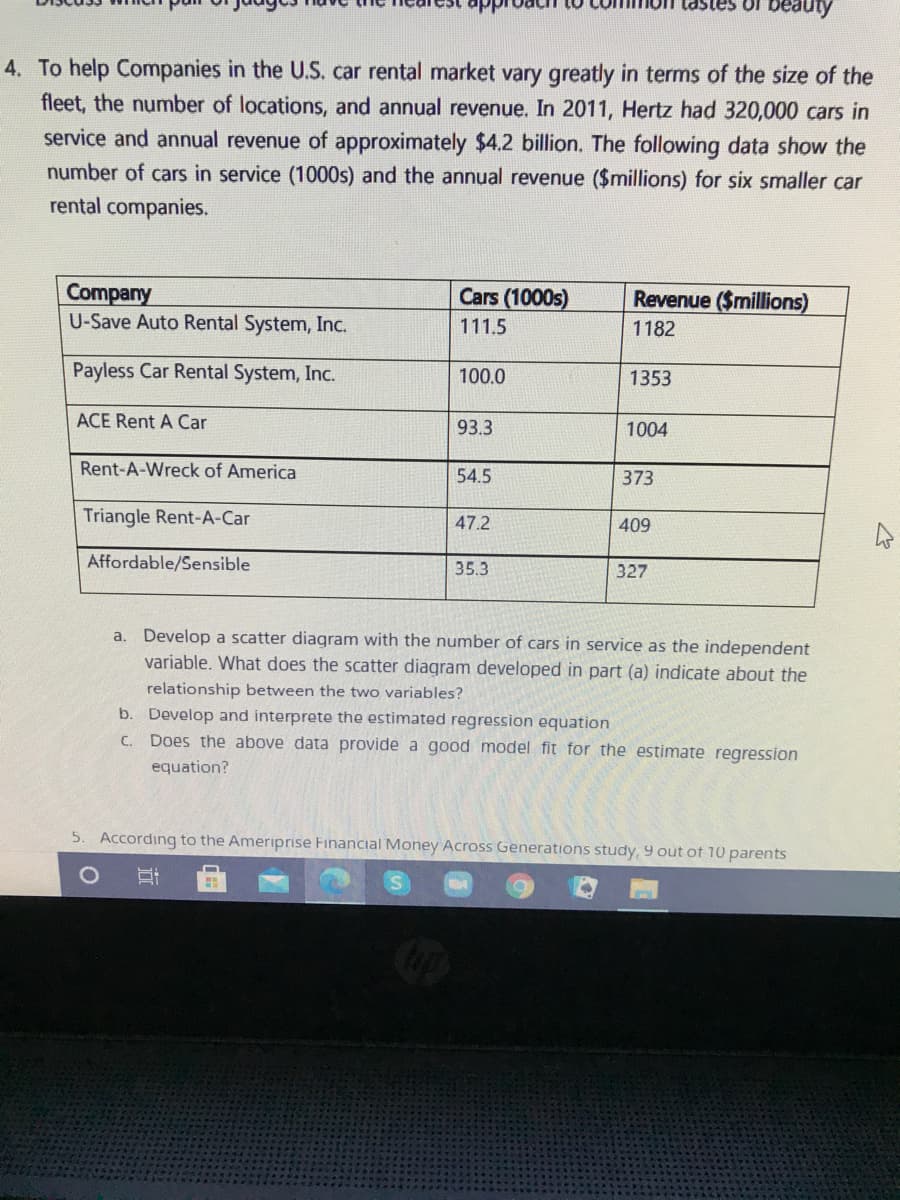
Given : We have given that the data of number of cars in service (1000s) and the annual revenue ($millions) for six smaller car rental companies .


Step 2

a) To plot scatter diagram for given data cars as independent variable ,

.

Statistics homework question answer, step 2, image 1

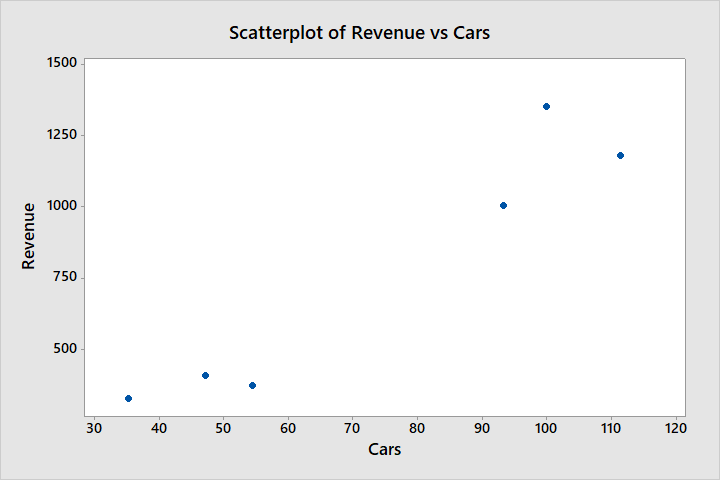
Interpretation :  There is positive relationship between number of cars and revenue. 

steps

Step by step

Solved in 4 steps with 1 images

Blurred answer
Knowledge Booster
Correlation, Regression, and Association
Learn more about
Need a deep-dive on the concept behind this application? Look no further. Learn more about this topic, statistics and related others by exploring similar questions and additional content below.
Similar questions
  • SEE MORE QUESTIONS
Recommended textbooks for you
Elementary Geometry for College Students
Geometry
ISBN:
9781285195698
Author:
Daniel C. Alexander, Geralyn M. Koeberlein
Publisher:
Cengage Learning