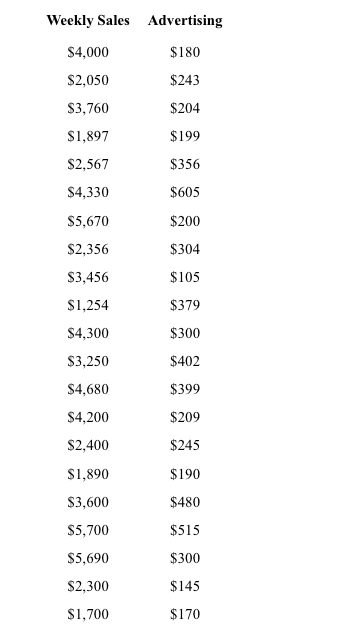
a. Develop the least square regression equation for these variables. Plot the regression line on the scatter plot. b. Develop a 95% confidence interval estimate for the increase in sales resulting from increasing the advertising budget by S1. Interpret the interval. C. Discuss whether it is appropriate to interpret the intercept value of this model. Under what conditions is it appropriate? Discuss.


Q: A scientist claims that there is a linear relationship between a lake’s flow rate and its runoff…
A: State the hypotheses.
Q: A researcher recorded the number of e-mails received in a month and the number of online purchases…
A: In this case, it is required to check whether the slope of the population regression line relating…
Q: Carpet City wants to develop a means to forecast its carpet sales. The store manager believes that…
A: a) Let X be the the monthly construction permits and Y be the monthly carpet sales. Since, Y is…
Q: Which of the following data sets could most appropriately be analyzed with a simple linear…
A: We have given the following graphs.
Q: A Math teacher wishes to determine if the number of absences a student incurs correlates with his or…
A:
Q: Given a set of data that has the following measures, find the least square regression line
A: The regression line is,…
Q: In regression with multiple input variables, which of the following can be a problem for finding…
A: Multiple regression analysis is also known as multiple linear regression (MLR) is a statistical…
Q: A house developer company wants to investigate the influencing factors when the customers buy a…
A: Given information: Model Unstandardised coefficients Beta Std. Error Constant 36.74 62.14…
Q: Consider the following sample of production volumes and total cost data for a manufacturing…
A: The given data is as follows:
Q: From the scatter plot, which of the following is FALSE? Bicarbonate (parts per million) 250 200 150…
A: We know that regression Hypothesis H0: β1 = 0 HA: β1 ≠ 0 That means the larger the distance…
Q: Consider the set of ordered pairs shown below. Assuming that the regression equation is y = 4.293…
A: Given : The regression equation is: Y^=4.2917+0.2083X \hat Y = 4.2917 + 0.2083 X Now that we have…
Q: Which of the following is not an example of systematic error in an observational study? A…
A: In general, systematic errors are calculation bias that contributes to the situation in which the…
Q: Discuss , in detail , ( using as many graphs and as much maths as possible ) , why the naïve…
A: From the given information, Consider,
Q: According to the nutrition research, recommendation on the consumption of fiber for children and…
A:
Q: Which one of the following cost estimation methods is the most accurate? Select one: a. The high-low…
A: The range of values of cost estimation and the probability of occurrence of actual cost between two…
Q: The following linear regression model predicts a person's height (cm) from the length of their shoe…
A: given linear regression model is Height = 3.5 x shoe print + 80 predicted height = ? shoe print =…
Q: The Table below summaries to model the relationship between a company sale and the sales for the…
A: Given - X Y X2 Y2 X*Y 10 0.5 100 0.25 5 12 1 144 1 12 13 1 169 1 13 15 1.4 225 1.96 21…
Q: Which of the following is not an assumption for simple linear regression? Select one: a. Normally…
A: In simple linear regression y = a + bx, y is response variable ane only one explanatory variable x.
Q: Use the following data to perform a regression analysis. What is the null hypothesis? What is the…
A: Given that X Y X \cdot YX⋅Y X^2X2 Y^2Y2 1 132 132 1 17424 2 131 262 4 17161 3 134…
Q: Given the regression line Ý = 2.5X +12, what is the predicted value of self-esteem where X = 5? O 14…
A: Given : regression line Ŷ = 2.5X +12, To find: what is the predicted value of self-esteem where X =…
Q: 4.3 The following data relate to the sales of a product over an eight-month period: Month Sales…
A: Given data: Sales (units) 56 72 70 65 68 75 66 67 Price 75 65 59 69 69 49 59 59
Q: A time series regression equation measuring the number of surfboards sold by a surfboard…
A: The time series regression equation is given as: Most of the statistical software programs identify…
Q: A recent study by a major financial investment company was interested in determining whether the…
A: The required value will provide by the following table: here, x is %change in profit and y is %…
Q: Which of the following circumstances would likely produce a regression model with very “good fit”.…
A: Regression model Regression is a statistical method used in finance, investing, and other…
Q: Consider the set of ordered pairs shown below. Assuming that the regression equation is y=2.063…
A: Given: The regression equation is: y^=2.063+0.531x SSE=4.813 x=5
Q: You are given the following data, where X1X1 (final percentage in math class) and X2X2 (number of…
A: Data given as, X1 (final percentage in math class) and X2 (number of absences) are used to predict…
Q: A candy bar manufacturer is interested in trying to estimate how sales are influenced by the price…
A: Step-by-step procedure to find the correlation coefficient using Excel: In Excel sheet, enter Price…
Q: A random sample of 9 statistics students produced the following data, Midterm Exam Score, x Final…
A: Given data: Midterm Exam Score, x Final Exam Score, y 18 87 84 75 48 10 22 60 46 60…
Q: Refer to the Minitab display below, which is based on a sample of 54 bears. Identify the multiple…
A: The fitted regression equation is given as WEIGHT = - 253 - 0.85*HEADLEN + 0.64*LENGTH + 12.1*CHEST
Q: A researcher notes that, in a certain region, a disproportionate number of software millionaires…
A: a) In this case Total Births in Region (x) is the independent variable and Number of Software…
Q: Refer to the Minitab display below, which is based on a sample of 54 bears. The regression equation…
A:
Q: Given that the equation of a regression line is y = 2x - 1, what is the best predicted value for y…
A:
Q: Write the regression equation that represents the above equation. Y = 9.804326378 + 0.65795*X1 +…
A: The F test is used to test whether the regression model is effective or not. In this test the null…
Q: Given the following data set, 10 8 13 9 11 14 6 4 12 7 5 9.14 8.14 8.74 8.77…
A: Let the fitted line be yi^=a^+b^xi.Then,b^=n∑i=1nxiyi-∑i=1nxi∑i=1nyin∑i=1nxi2-∑i=1nxi2 and…
Q: Which of the following residual plots suggests that a linear model may not be applicable to the data…
A: The residuals (e) are calculated by taking difference between observed value and predicted value…
Q: The information provided on the "Cruffins" worksheet in the data pack can be used to estimate the…
A: SUMMARY OUTPUT Regression Statistics…
Q: The following sample observations were randomly selected X Y 4 4 5 6 3 5 6 7 10 7 What is the…
A: The regression equation Y on X is, Y=a+bXwherea=intercept of regression lineb=slope of regression…
Q: Q1. (a) Write down the four assumptions of the simple linear regression model. (b) Draw graphs for…
A:
Q: The following are linear regression lines with prediction and confidence intervals. For each of the…
A: Given a sample of 48 apartment rental results in the regression graphs.
Q: In exercise 7, the data on y = annual sales ($1000s) for new customer accounts and x = number of…
A:
Q: Which of the following situations would require a categorical variable in a multiple linear…
A:
Q: Given the following data for four houses sold in comparable neighborhoods and their corresponding…
A: Given data represents the values of the variables Square feet and selling price.
Q: Which of the following would affect the reliability of a forecast made using linear regression? (i)…
A: One of the basic assumptions in linear regression is the assumption of linear relationship between…
Q: The following data are the monthly salaries and the grade point averages for students who obtained…
A: a. The data related to the monthly salaries (y) and the grade point averages (x) for students, who…
Q: Find the equation of the regression line for the following data set. y= 10 - 4 *456 y654
A: Formula: The equation of regression line is given by Y = a + bX, where a = ∑y∑x2-∑x∑xyn∑x2 - ∑x2, b…
Q: One of the lines in the following scatter plot is the regression line fitted to the data. Which of…
A: Given: One of the lines in the scatter plot is the regression line fitted to the data. (a) The red…
Q: A company sells copiers and performs preventative maintenance and repair services. The manager wants…
A:
Q: 21. The linear regression equation is: a. y-hat = 79.96 + 0.0094x b. y-hat = 0.0094 – 79.96x c.…
A: Following Data is given : X Y Number of Employees Number of Bathrooms 650 40 730 50 810…


Learn your way
Includes step-by-step video

Step by step
Solved in 4 steps with 2 images

- Box Office Hits The table below shows the highest grossing movie of the given year. The amount is the domestic box office gross, in millions of dollars. Year Movie Amount(millions) 2006 Pirates of the Caribbean: Dead Mans chest 423.32 2007 Spider-Man 3 336.53 2008 The Dark Knight 533.35 2009 Avatar 760.51 2010 Toy Story 3 415.00 2011 Harry Potter and the Deathly Hallows: Part 2 381.01 2012 The Avengers 623.28 2013 The Hunger Games: Catching Fire 424.67 2014 American Sniper 350.13 Let M=M(y) denote the highest grossing movie in year y, and let B=B(y) denote the gross for that movie. a. Give the values of M(2014) and B(2014). b. Use the functional notation to indicate the amount for the movie with the highest gross in 2013.Marginal Tax Rate The following table shows tax due for the given taxable income level for a single taxpayer. Taxable income Tax due 97, 000 21, 913 97, 050 21, 927 97, 100 21, 941 97, 150 21, 955 97, 200 21, 969 a. Show that the data in the table are linear. b. How much additional tax is due on each dollar over 97.000? c. What would you expect to be your tax due if you had a taxable income of 97, 000? of 98, 000? d. Find a linear formula that gives your tax due if your income is A dollars over 97, 000.Monthly Household Spending ($) Annual Household Income ($) HouseholdSize 4,016 54000 3 3,159 30000 2 5,100 32000 4 4,742 50000 5 1,864 31000 2 4,070 55000 2 2,731 37000 1 3,348 40000 2 4,764 66000 4 4,110 51000 3 4,208 25000 3 4,219 48000 4 2,477 27000 1 2,514 33000 2 4,214 65000 3 4,965 63000 4 4,412 42000 6 2,448 21000 2 2,995 44000 1 4,171 37000 5 5,678 62000 6 3,623 21000 3 5,301 55000 7 3,020 42000 2 4,828 41000 7 5,573 54000 6 2,583 30000 1 3,866 48000 2 3,586 34000 5 5,037 67000 4 3,605 50000 2 5,345 67000 5 5,370 55000 6 3,890 52000 2 4,705 62000 3 4,157 64000 2 3,579 22000 3 3,890 29000 4 2,972 39000 2 3,121 35000 1 4,183 39000 4 3,730 54000 3 4,127 23000 6 2,921 27000 2 4,603 26000 7 4,273 61000 2 3,067 30000 2 3,074 22000 4 4,820 46000 5 5,149 66000 4 Use Excel’s Data Analysis tool to conduct a multiple regression analysis with annual income and household size as…
- Monthly Household Spending ($) Annual Household Income ($) HouseholdSize 4,016 54000 3 3,159 30000 2 5,100 32000 4 4,742 50000 5 1,864 31000 2 4,070 55000 2 2,731 37000 1 3,348 40000 2 4,764 66000 4 4,110 51000 3 4,208 25000 3 4,219 48000 4 2,477 27000 1 2,514 33000 2 4,214 65000 3 4,965 63000 4 4,412 42000 6 2,448 21000 2 2,995 44000 1 4,171 37000 5 5,678 62000 6 3,623 21000 3 5,301 55000 7 3,020 42000 2 4,828 41000 7 5,573 54000 6 2,583 30000 1 3,866 48000 2 3,586 34000 5 5,037 67000 4 3,605 50000 2 5,345 67000 5 5,370 55000 6 3,890 52000 2 4,705 62000 3 4,157 64000 2 3,579 22000 3 3,890 29000 4 2,972 39000 2 3,121 35000 1 4,183 39000 4 3,730 54000 3 4,127 23000 6 2,921 27000 2 4,603 26000 7 4,273 61000 2 3,067 30000 2 3,074 22000 4 4,820 46000 5 5,149 66000 4 Develop a scatter plot between annual household spending and annual income. The scatter diagram should include a proper…Income($1000s) HouseholdSize AmountCharged ($) 54 3 4,016 30 2 3,159 32 4 5,100 50 5 4,742 31 2 1,864 55 2 4,070 37 1 2,731 40 2 3,348 66 4 4,764 51 3 4,110 25 3 4,208 48 4 4,219 27 1 2,477 33 2 2,514 65 3 4,214 63 4 4,965 42 6 4,412 21 2 2,448 44 1 2,995 37 5 4,171 62 6 5,678 21 3 3,623 55 7 5,301 42 2 3,020 41 7 4,828 54 6 5,573 30 1 2,583 48 2 3,866 34 5 3,586 67 4 5,037 50 2 3,605 67 5 5,345 55 6…South Shore Construction builds permanent docks and seawalls along the southern shore of Long Island, New York. Although the firm has been in business only five years, revenue has increased from $308,000 in the first year of operation to $1,084,000 in the most recent year. The following data show the quarterly sales revenue in thousands of dollars. Quarter Year 1 Year 2 Year 3 Year 4 Year 5 1 20 37 75 92 176 2 100 136 155 202 282 3 175 245 326 384 445 4 13 26 48 82 181 Let Period = 1 refer to the observation in quarter 1 of year 1; Period = 2 refer to the observation in quarter 2 of year 1; ... and Period = 20 refer to the observation in quarter 4 of year 5. Using the dummy variables (Qtr1 = 1 if quarter 1, 0 otherwise; Qtr2 = 1 if quarter 2, 0 otherwise; Qtr3 = 1 if quarter 3, 0 otherwise) and the variable Period, develop an equation to account for seasonal effects and any linear trend in the time series. Based on the seasonal effects…
- South Shore Construction builds permanent docks and seawalls along the southern shore of Long Island, New York. Although the firm has been in business only five years, revenue has increased from $308,000 in the first year of operation to $1,084,000 in the most recent year. The following data show the quarterly sales revenue in thousands of dollars. Quarter Year 1 Year 2 Year 3 Year 4 Year 5 1 20 37 75 92 176 2 100 136 155 202 282 3 175 245 326 384 445 4 13 26 48 82 181 Let Period = 1 refer to the observation in quarter 1 of year 1; Period = 2 refer to the observation in quarter 2 of year 1; ... and Period = 20 refer to the observation in quarter 4 of year 5. Using the dummy variables (Qtr1 = 1 if quarter 1, 0 otherwise; Qtr2 = 1 if quarter 2, 0 otherwise; Qtr3 = 1 if quarter 3, 0 otherwise) and the variable Period, develop an equation to account for seasonal effects and any linear trend in the time series. Estimate MSE using the model…South Shore Construction builds permanent docks and seawalls along the southern shore of Long Island, New York. Although the firm has been in business only five years, revenue has increased from $304,000 in the first year of operation to $1,094,000 in the most recent year. The following data show the quarterly sales revenue in thousands of dollars. Quarter Year 1 Year 2 Year 3 Year 4 Year 5 1 25 28 68 94 179 2 90 138 151 199 274 3 176 255 324 385 451 4 13 18 42 74 190Data: Household Amount Income 1 555 4392 2 489 4562 3 458 4797 4 613 4860 5 647 4860 6 661 4903 7 662 4903 8 675 5095 9 549 5137 10 606 5308…
- Average Tuition and Fees in 2014 Dollars 2000-2015 Academic Year Public 4-year Public 2-year 00-01 $4,837 $2,264 01-02 $5,055 $2,158 02-03 $5,241 $2,214 03-04 $6,018 $2,473 04-05 $6,448 $2,615 05-06 $6,696 $2,660 06-07 $6,795 $2,653 07-08 $7,081 $2,624 08-09 $7,148 $2,580 09-10 $7,825 $2,842 10-11 $8,337 $2,997 11-12 $8,728 $3,135 12-13 $8,991 $3,280 13-14 $9,062 $3,306 14-15 $9,139 $3,347 Tuition and fees at public four-year and public two-year institutions from 2000-2015 are shown in the table and the graph above. Values have been adjusted to 2014 dollars to account for inflation. a. What is the absolute change in tuition and fees at public four-year institutions from 2000-01 to 2014-15? b. Calculate the relative change in tuition and fees at public four-year institutions from 2000-01 to 2014-15. Round to the nearest whole percentage point.winning time (minutes)(minutes) year men women 1966 137.18 201.67 1967 135.75 207.28 1968 142.28 210.00 1969 133.82 202.77 1970 130.50 185.12 1971 138.75 188.50 1972 135.65 190.43 1973 136.05 185.98 1974 133.65 167.18 1975 129.92 162.40 1976 140.32 167.17 1977 134.77 168.55 1978 130.22 164.87 1979 129.45 155.25 1980 132.18 154.47 1981 129.43 146.77 1982 128.87 149.55 1983 129.00 142.72 1984 130.57 149.47 1985 134.08 154.10 1986 127.85 144.92 1987 131.83 145.35 1988 128.72 144.50 1989 129.10 144.55 1990 128.32 145.40 1991 131.10 144.30 1992 128.23 143.72 1993 129.55 145.45 1994 127.25 141.75 1995 129.37 145.18 1996 129.25 147.20 1997 130.57 146.38 1998 127.57 143.35 1999 129.87 143.42 2000 129.78 146.18 2001 129.72 143.88 2002 129.03 140.72 2003 130.18 145.32 2004 130.62 144.45 2005 131.73 145.20 2006 127.23 143.63 2007 134.22 149.30 2008 127.75 145.42 2009 128.70 152.27 2010 125.87 146.18 2011…Given information: Monthly Household Spending ($) Annual Household Income ($) HouseholdSize 4016 54000 3 3159 30000 2 5100 32000 4 4742 50000 5 1864 31000 2 4070 55000 2 2731 37000 1 3348 40000 2 4764 66000 4 4110 51000 3 4208 25000 3 4219 48000 4 2477 27000 1 2514 33000 2 4214 65000 3 4965 63000 4 4412 42000 6 2448 21000 2 2995 44000 1 4171 37000 5 5678 62000 6 3623 21000 3 5301 55000 7 3020 42000 2 4828 41000 7 5573 54000 6 2583 30000 1 3866 48000 2 3586 34000 5 5037 67000 4 3605 50000 2 5345 67000 5 5370 55000 6 3890 52000 2 4705 62000 3 4157 64000 2 3579 22000 3 3890 29000 4 2972 39000 2 3121 35000 1 4183 39000 4 3730 54000 3 4127 23000 6 2921 27000 2 4603 26000 7 4273 61000 2 3067 30000 2 3074 22000 4 4820 46000 5 5149 66000 4 EXCEL (Data Analysis) output: SUMMARY OUTPUT Regression Statistics Multiple R 0.908603921 R…