Write the regression equation that represents the above equation.  Y = 9.804326378  + 0.65795*X1 + 0.200358 X2  Height of an individual = 9.8043 + 0.6579*Mother's Height + 0.2004* Father's Height     2)Is this a good predictor equation? Why or why not (use appropriate statistics/hypothesis test to prove your point)?

Functions and Change: A Modeling Approach to College Algebra (MindTap Course List)
6th Edition
ISBN:9781337111348
Author:Bruce Crauder, Benny Evans, Alan Noell
Publisher:Bruce Crauder, Benny Evans, Alan Noell
Chapter5: A Survey Of Other Common Functions
Section5.6: Higher-degree Polynomials And Rational Functions
Problem 14SBE: Quartic Regression In Exercise S-8 through S-14, use regression to find a quartic model for the...
icon
Related questions
icon
Concept explainers
Question

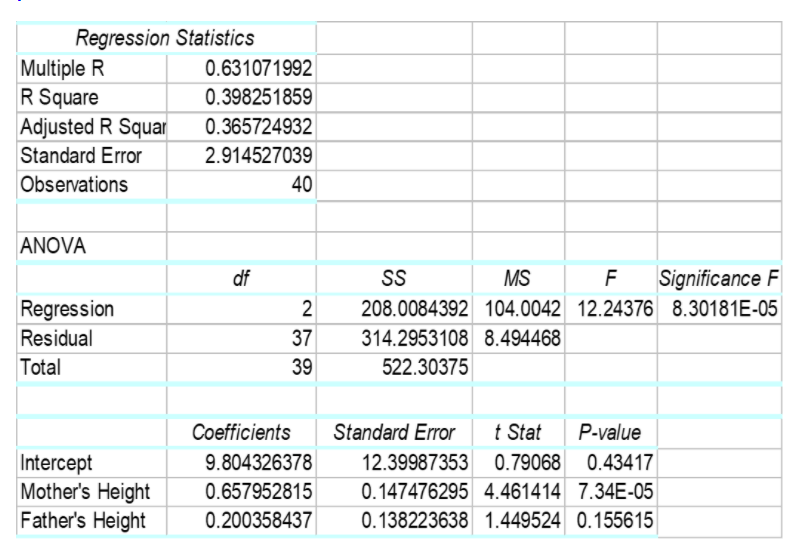
1)Write the regression equation that represents the above equation.

 Y = 9.804326378  + 0.65795*X1 + 0.200358 X2 

Height of an individual = 9.8043 + 0.6579*Mother's Height + 0.2004* Father's Height


2)Is this a good predictor equation? Why or why not (use appropriate statistics/hypothesis test to prove your point)?

Regression Statistics
Multiple R
R Square
Adjusted R Squar
Standard Error
0.631071992
0.398251859
0.365724932
2.914527039
Observations
40
ANOVA
df
SS
MS
F Significance F
Regression
Residual
208.0084392 104.0042 12.24376 8.30181E-05
37
314.2953108 8.494468
Total
39
522.30375
Coefficients
Standard Error
t Stat
P-value
9.804326378
Intercept
Mother's Height
Father's Height
12.39987353 0.79068 0.43417
0.657952815
0.147476295 4.461414 7.34E-05
0.200358437
0.138223638 1.449524 0.155615
Transcribed Image Text:Regression Statistics Multiple R R Square Adjusted R Squar Standard Error 0.631071992 0.398251859 0.365724932 2.914527039 Observations 40 ANOVA df SS MS F Significance F Regression Residual 208.0084392 104.0042 12.24376 8.30181E-05 37 314.2953108 8.494468 Total 39 522.30375 Coefficients Standard Error t Stat P-value 9.804326378 Intercept Mother's Height Father's Height 12.39987353 0.79068 0.43417 0.657952815 0.147476295 4.461414 7.34E-05 0.200358437 0.138223638 1.449524 0.155615
Expert Solution
steps

Step by step

Solved in 3 steps

Blurred answer
Knowledge Booster
Correlation, Regression, and Association
Learn more about
Need a deep-dive on the concept behind this application? Look no further. Learn more about this topic, statistics and related others by exploring similar questions and additional content below.
Similar questions
Recommended textbooks for you
Functions and Change: A Modeling Approach to Coll…
Algebra
ISBN:
9781337111348
Author:
Bruce Crauder, Benny Evans, Alan Noell
Publisher:
Cengage Learning
College Algebra
College Algebra
Algebra
ISBN:
9781938168383
Author:
Jay Abramson
Publisher:
OpenStax
Glencoe Algebra 1, Student Edition, 9780079039897…
Algebra
ISBN:
9780079039897
Author:
Carter
Publisher:
McGraw Hill
Algebra & Trigonometry with Analytic Geometry
Algebra
ISBN:
9781133382119
Author:
Swokowski
Publisher:
Cengage
College Algebra
College Algebra
Algebra
ISBN:
9781337282291
Author:
Ron Larson
Publisher:
Cengage Learning
College Algebra
College Algebra
Algebra
ISBN:
9781305115545
Author:
James Stewart, Lothar Redlin, Saleem Watson
Publisher:
Cengage Learning